Chapter 6: Using the Web Interface
235
2.
If any LHX sensors fail, they are indicated. Click Acknowledge to
acknowledge the sensor failure.
3.
To view the history of LHX events, click Show Event Log to go to the
Event Log page.
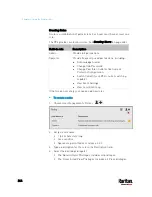
Operation time statistics:
This section indicates the accumulative operation hours of the LHX/SHX
device and its fans since the device is connected to the PX3 and turned
on.
Available time units in the statistics --
h: hour(s)
d: day(s)
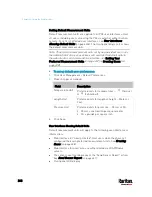
Request maximum cooling:
Only SHX 30 supports this feature. See
SHX Request Maximum Cooling
(on page 236).
Содержание PX3-3000 series
Страница 5: ......
Страница 18: ...Contents xviii Index 841...
Страница 66: ...Chapter 3 Initial Installation and Configuration 42 Number Device role Master device Slave 1 Slave 2 Slave 3...
Страница 93: ...Chapter 4 Connecting External Equipment Optional 69...
Страница 787: ...Appendix J RADIUS Configuration Illustration 763 Note If your PX3 uses PAP then select PAP...
Страница 788: ...Appendix J RADIUS Configuration Illustration 764 10 Select Standard to the left of the dialog and then click Add...
Страница 789: ...Appendix J RADIUS Configuration Illustration 765 11 Select Filter Id from the list of attributes and click Add...
Страница 792: ...Appendix J RADIUS Configuration Illustration 768 14 The new attribute is added Click OK...
Страница 793: ...Appendix J RADIUS Configuration Illustration 769 15 Click Next to continue...
Страница 823: ...Appendix K Additional PX3 Information 799...
Страница 853: ...Appendix L Integration 829 3 Click OK...

