


Interference Analyzer
R&S
®
Cable Rider ZPH
303
User Manual 1321.0950.02 ─ 07
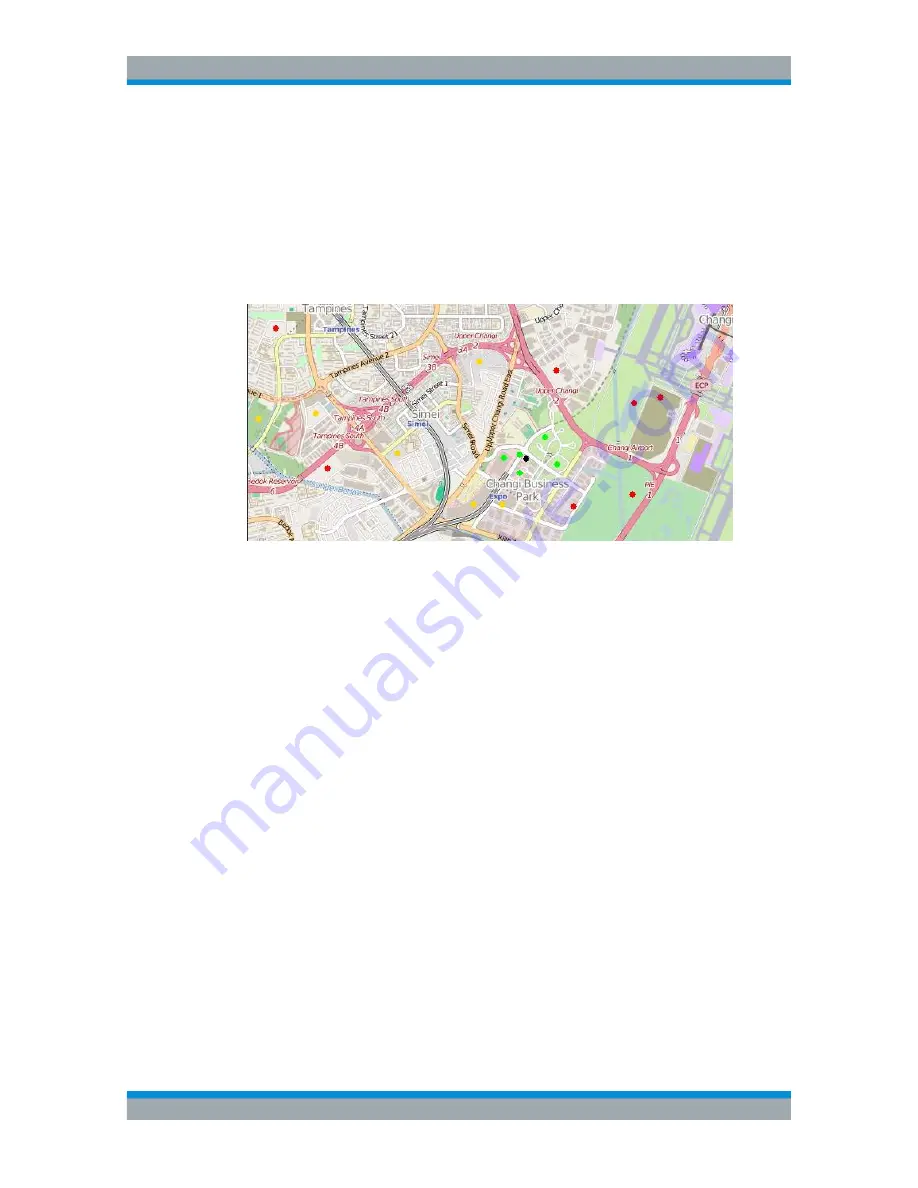
In indoor and outdoor mapping, a colored dot is added to the map when you make a
measurement and save the result at that location. The color represents the signal level
at that location.
The following shows the default color of the geotag signal strength on the map.
●
Red color: Signal reception is bad.
●
Yellow color: Signal reception is average.
●
Green color: Signal reception is good.
Figure 13-3: Display the geotag in outdoor mapping
To change the default color of the geotag signal strength, do the following:
1. Press the [MEAS] key.
2. Select the "Settings" softkey.
3. Select the "Colors" softkey.
The R&S Cable Rider ZPH opens a submenu to select the different coverage con-
ditions and its associate level definition.
4. Select the "Good Coverage Color", "Average Coverage Color" or "Bad Coverage
Color" menu item to change the color representation of these coverage conditions.
The R&S Cable Rider ZPH opens a submenu to select the color.
5. Select a color of your choice.
6. Select the "Colors" softkey.
7. Select the "Good Coverage Level", "Average Coverage Level" or "Bad Coverage
Level" menu item to change the level representation of these coverage conditions.
The R&S Cable Rider ZPH opens an input field to define the level entry associated
with the coverage conditions.
Working with Maps


