D-62
Chapter D - Software
Automated Chemistry Analyzer
AU2700 User's Guide
May, 2002
2.5 Photocal Monitor
OLP3020
F5
F3
F3
F3
Selecting a cuvette
on which the Photocal
measurement results
are to be referred
Displaying the latest
Photocal data in
numeric values
(R) Routine
(P)Photocal Monitor
Graphically displaying
the Photocal data
records
Displaying the
Photocal data
records as
numerical values
Setting the
displaying conditions
Outputting the
Photocal
measurement
results to a data list
Change
Axis
One of the tabs
can be selected
Button function
Described in
another section.
Press this key.
Main operation flow
Operation flow
ALARMCLEAR
?
STANDBY
Help
Exit
Photocal Monitor
11/30/2000
10:10
OLP1pm
1 2 3 4 5 6 7 8 9 10 11 12 13 14 15
16 17 18 19 20 21 22 23 24 25 26 27 28 29 30
31 32 33 34 35 36 37 38 39 40 41 42 43 44 45
46 47 48 49 50 51 52 53 54 55 56 57 58 59 60
61 62 63 64 65 66 67 68 69 70 71 72 73 74 75
76 77 78 79 80 81 82 83 84 85 86 87 88 89 90
91 92 93 94 95 96 97 98 99 100 101 102 103 104 105
106 107 108 109 110 111 112 113 114 115 116 117 118 119 120
121 122 123 124 125 126 127 128 129 130 131 132 133 134 135
136 137 138 139 140 141 142 143 144 145 146 147 148 149 150
151 152 153 154 155 156 157 158 159 160 161 162 163 164 165
Cuvette No.
Mean Check Error
Cuvette Check Error
Abs. Check Error
Cuvette Inner
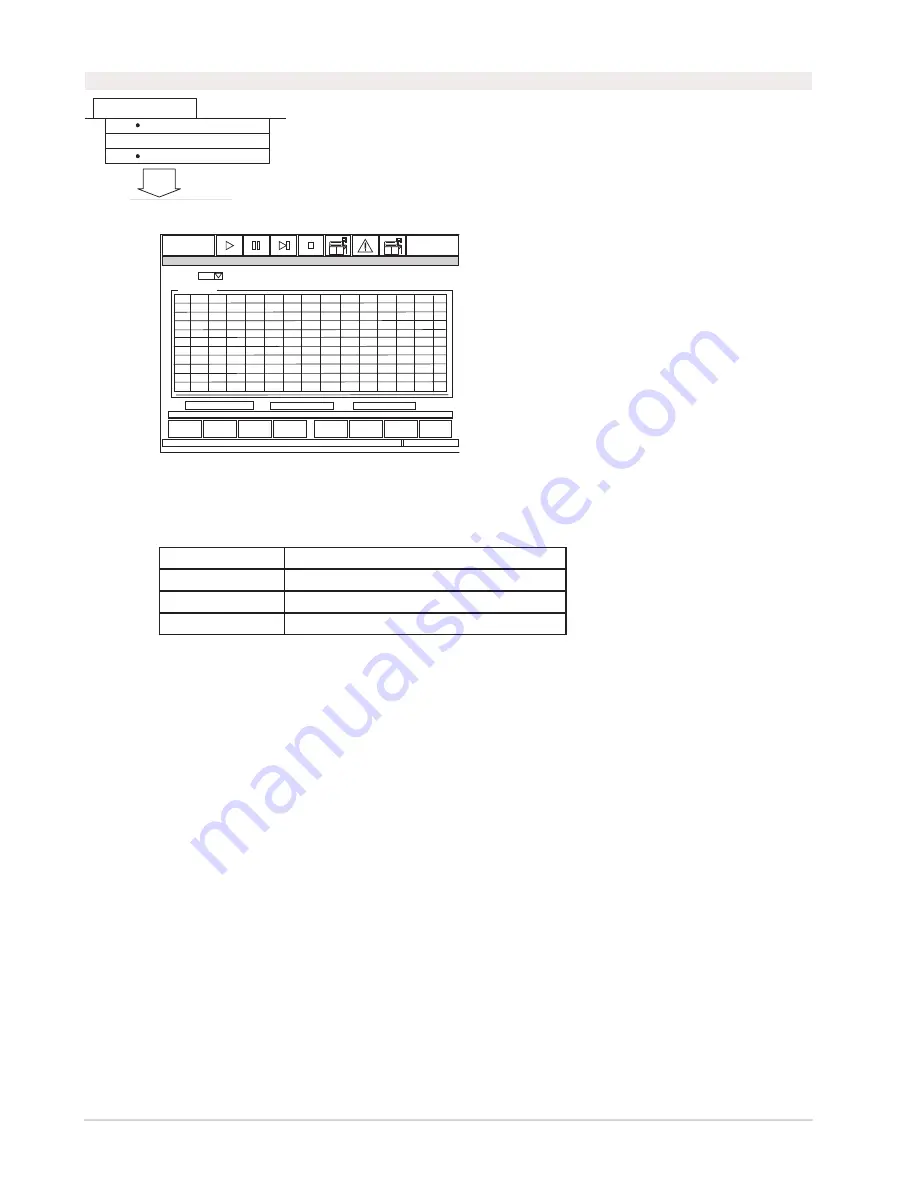
Description:
After a photocal measurement, always confirm the measured results. Use this screen to display
cuvette status:
White
Cuvettes passed the photocal
Green
Failed the cuvette check
Red
Failed the mean check
Blue
Failed the base check (absolute check)
Use this software screen to:
Verify cuvette status:
Verify the status of all cuvettes from this screen. Use the pull-down menu to select the inner or
outer wheel. A list of cuvette numbers appear. The cuvettes are color-coded to indicate photocal
status as shown above.
Any cuvette that failed the mean check or cuvette check will need to be
corrected. For procedures, refer to "Perform a Photocal" located in the Maintenance Chapter.
Display the latest photocal data in numeric values:
Using your mouse, select a cuvette number.
The latest photocal data is displayed.
Display photocal history in a graph or data format:
1. Select [Routine], [Photocal Monitor].
2. Select a cuvette number.
3. Select function key F5 (history graph) to display data in a graph or F6 (history data) to
display data in a list.
Содержание AU2700
Страница 17: ...A 4b Automated Chemistry Analyzer AU2700 User s Guide November 1 2009 This page intentionally left blank ...
Страница 178: ...D 4 Chapter D Software Automated Chemistry Analyzer AU2700 User s Guide March 31 2005 ...
Страница 260: ...D 86 Chapter D Software Automated Chemistry Analyzer AU2700 User s Guide May 2002 ...


