


R&S
®
ZVL
System Overview
Basic Concepts
Quick Start Guide 1303.6538.62-01
70
The front panel key bar provides access to the basic groups of settings with a single
mouse click. It is particularly useful if the analyzer is controlled with a mouse or via
Remote Desktop
. Alternatively the settings are accessible from the menus of the menu
bar or from the softkey bar.
The front panel key bar is hidden by default to gain screen space for the diagram
areas.
3.1.4.5 Status
Bar
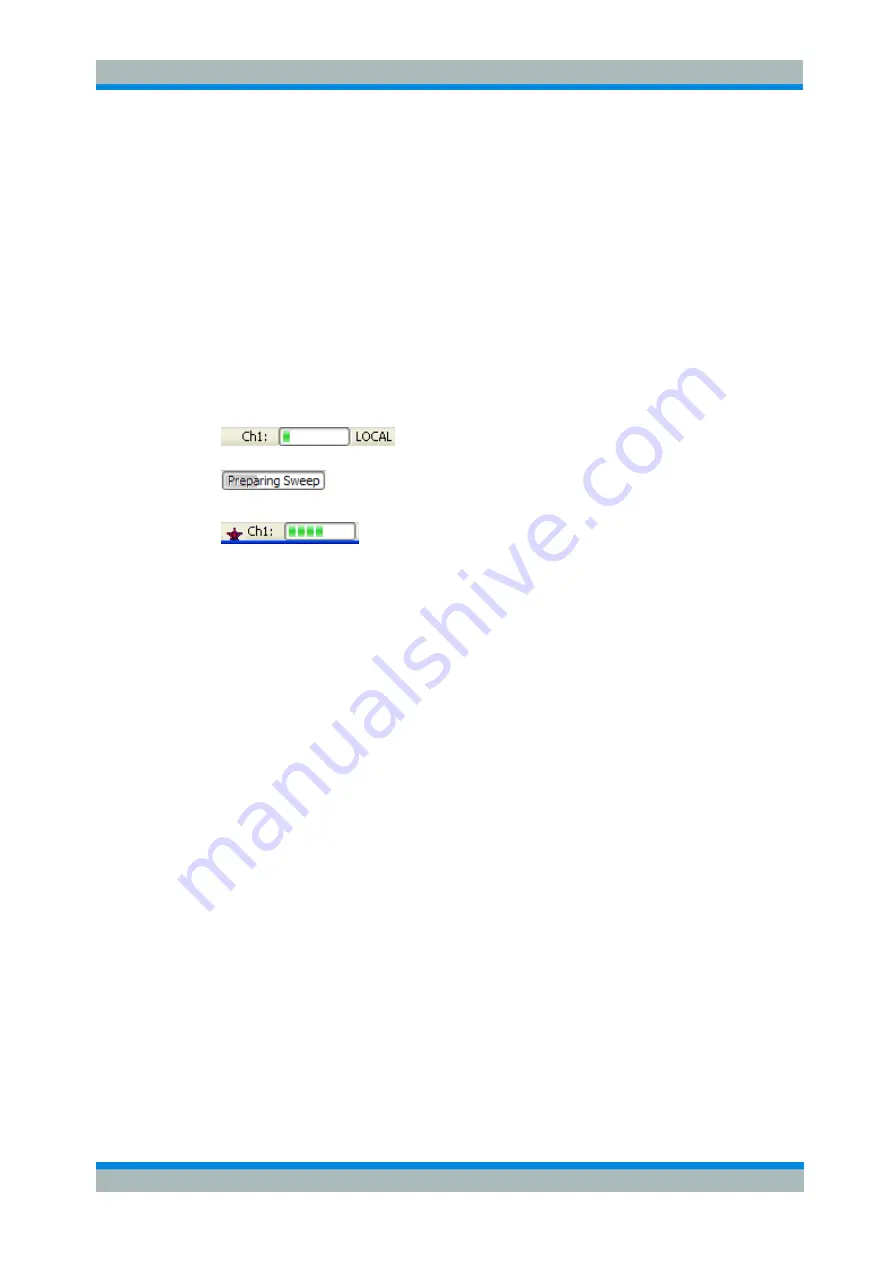
The status bar (Setup/Display Config.) shows the statistics for the sweep average (if
sweep average is on). the progress of the sweep, a symbol for the current power
supply option (AC, DC, battery, battery low), and the control mode of the analyzer
(LOCAL or REMOTE).
During sweep initialization, the progress bar for the sweep is replaced by a
symbol. During the first sweep after a change of the channel settings,
an additional red asterisk symbol appears:
You can hide the status bar and gain screen space for the diagram areas.
3.1.5 Display Elements in the Diagram Area
The central part of the screen is occupied by one or several diagram areas.
Diagram Areas
A diagram area is a rectangular portion of the screen used to display traces. Diagram
areas are arranged in windows; they are independent of trace and channel settings. A
diagram area can contain a practically unlimited number of traces, assigned to different
channels (overlay mode).
Diagram areas are controlled and configured by means of the functions in the
Display
menu and the following additional settings:
E
The settings in the
Nwa-Setup – Display
submenu arrange several windows
containing one or more diagram areas within the entire screen. Each window
corresponds to a setup. Only one setup can be active at a time, and only the traces
of the active setup are updated by the current measurements.
E
Various settings to assign traces to diagram areas are provided in the
Trace –
Trace-> – Traces
submenu.
Diagram areas may contain:
E
Measurement results, in particular the traces and marker values
E
An indication of the basic channel and trace settings
E
Context menus providing settings related to the current screen
The examples in this section have been taken from Cartesian diagrams. All other
diagram types provide the same display elements.


