


R&S
ZVL
Getting Started
Reflection Measurements
Operating manual 1303.6538.62 - 05
44
1. Proceed as described in section
Starting the Analyzer and
Shutting Down
in Chapter 1 to
switch on the instrument and
start the NWA application.
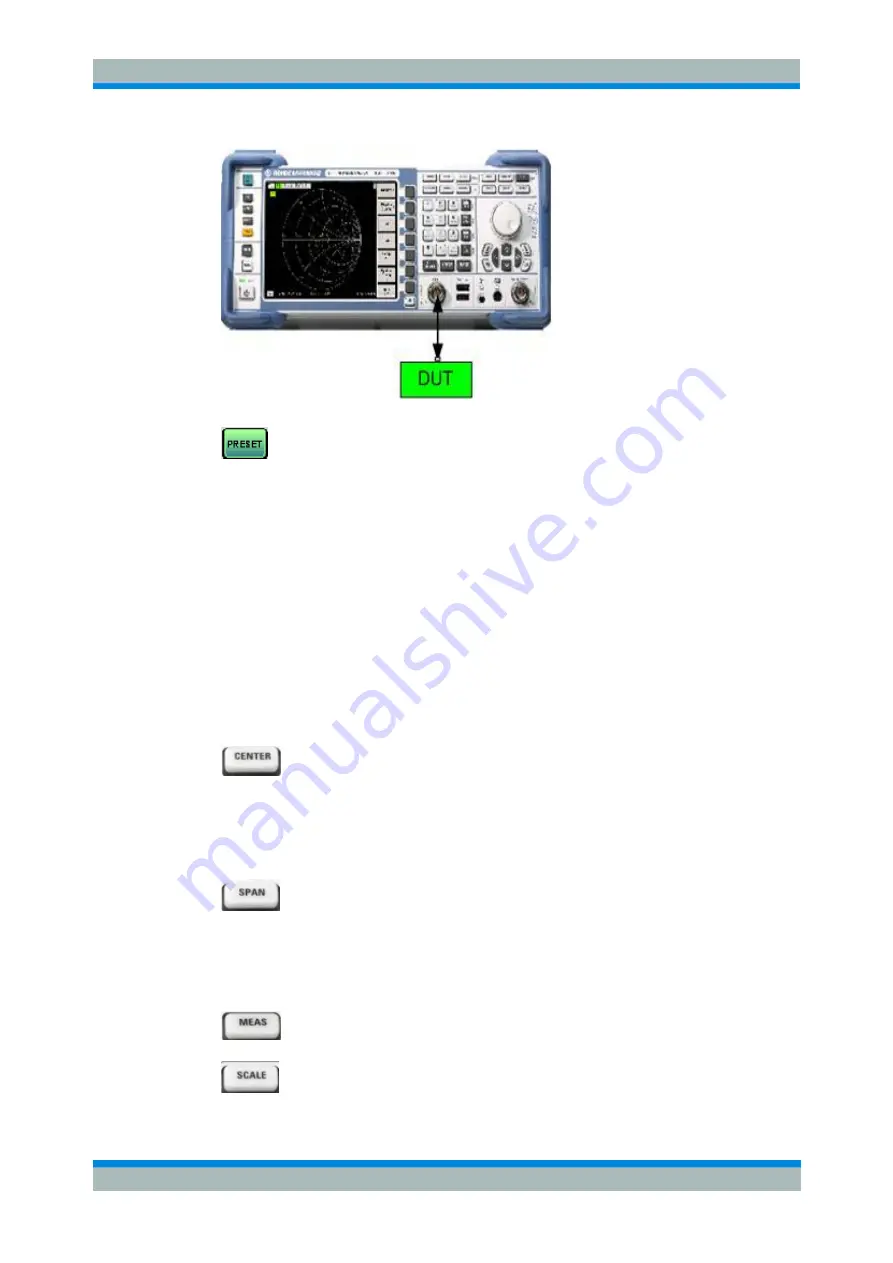
2. Connect the input port of your
DUT to test port 1 of the network
analyzer.
3. Press the PRESET key in the
upper left corner of the front
panel to perform a factory preset
of the analyzer.
The analyzer is now set to its default
state. The default measured quantity
is the transmission S-parameter S
21
.
This quantity is zero in the current
test setup, so the trace shows the
noise level.
2.1.2 Parameter and Sweep Range Selection
After preset the display shows a diagram with a dB Mag scale. The sweep range (scale
of the horizontal axis) is equal to the maximum frequency range of the analyzer, and
the S-parameter S
12
is selected as a measurement parameter.
To obtain information about the reflection characteristics of your DUT you have to
select an appropriate measurement parameter and specify the sweep range.
1. Press the CENTER function key to the right of the display to open
the associated numeric entry bar (Center Frequency). Enter the
center of your desired frequency range in (e.g. 5.25 GHz).
If you use the data keys at the front panel for data entry, simply type 5.25
and terminate the entry with the
G/n
key. Refer to section
Data Entry
to
learn more about entering numeric values and characters.
2. Press SPAN and enter the width of the frequency range you want to
measure (e.g. 0.5 GHz).
In addition to the linear frequency sweep considered in this example the
analyzer provides frequency sweeps with a logarithmic or segmented
frequency axis. Refer to
Setting up a Sweep
for more application
examples.
3. Press MEAS and select the forward reflection coefficient S
11
as a
measurement parameter.
4. Press SCALE and activate the
Autoscale
function.
The analyzer adjusts the scale of the diagram to fit in the entire S
11
trace,


