


Measurements
R&S
®
RTO6
344
User Manual 1801.6687.02 ─ 05
8.2.8.3
Creating histograms
Histograms can be used to evaluate the sample value occurrences directly. They are a
prerequisite for histogram measurements.
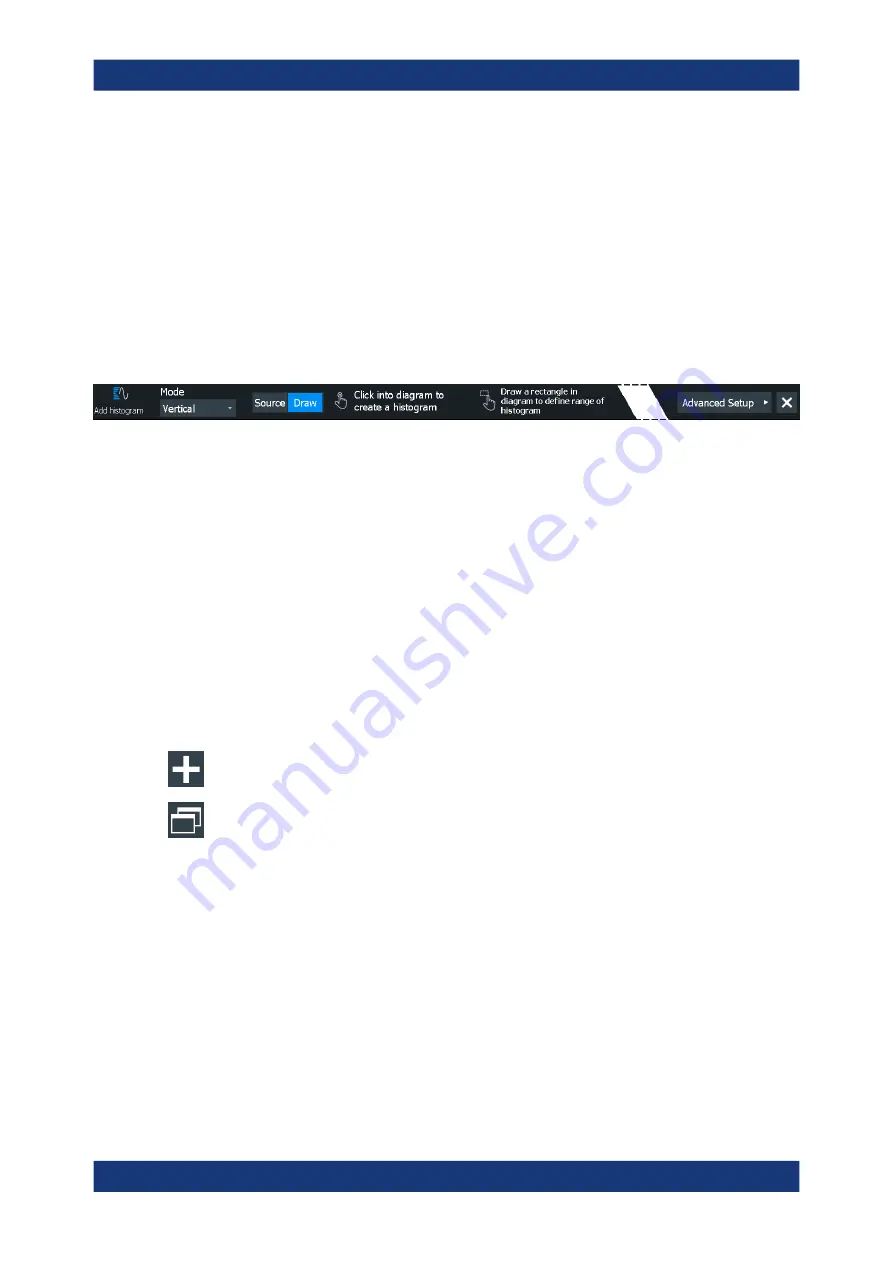
To create a histogram quickly with toolbar icons
1. Select the waveform for which you need a histogram.
2. Tap the histogram icon on the toolbar.
3. Select the histogram type on the overlay menu: "Mode" = vertical for an amplitude
histogram, or horizontal for a time-based histogram.
4. Tap the diagram with the waveform to be measured, or draw a rectangle on the
screen to define the area for histogram calculation.
Alternatively, tap "Source" and select the waveform.
The histogram range is indicated in the diagram and a histogram with the selected
waveform as a source is defined and displayed.
5. To adjust the histogram range:
a) Double-tap the histogram.
b) Tap "Advanced Settings" on the overlay menu.
c) Adjust the start and stop values.
To create and configure a histogram in the dialog box
1. Select "Menu" > "Apps" > "Analysis" tab > "Histogram".
The "Histogram" dialog box is displayed.
2. To create a histogram, tap the "Add" icon in the upper right corner of the dialog
box.
3. To copy an existing histogram and configure a new one based on those settings,
tap the "Copy" icon.
4. To change the name of a histogram, double-tap the tab label. Enter a name for the
histogram using the on-screen keyboard.
5. Select a "Source" for the histogram. The source can be any input signal, math or
reference waveform.
6. Define the histogram "Mode": vertical for an amplitude, horizontal for a time-based
histogram.
7. Define the range of the waveform for which the histogram is to be generated. Enter
the start value and the stop value in x and in y direction, either as absolute or rela-
tive values.
Automatic measurements


