


Common Analysis and Display Functions
R&S
®
ESW
222
User Manual 1177.6298.02 ─ 08
To select a color scheme
You can select which colors are assigned to the measured values.
► In the "Color Mapping" dialog box, select the option for the color scheme to be
used.
Editing the value range of the color map
The distribution of the measured values is displayed as a histogram in the "Color Map-
ping" dialog box. To cover the entire measurement value range, make sure the first and
last bar of the histogram are included.
To ignore noise in a spectrogram, for example, exclude the lower power levels from the
histogram.
The value range of the color map must cover at least 10% of the value range on the
horizontal axis of the diagram, that means, the difference between the start and stop
values must be at least 10%.
The value range of the color map can be set numerically or graphically.
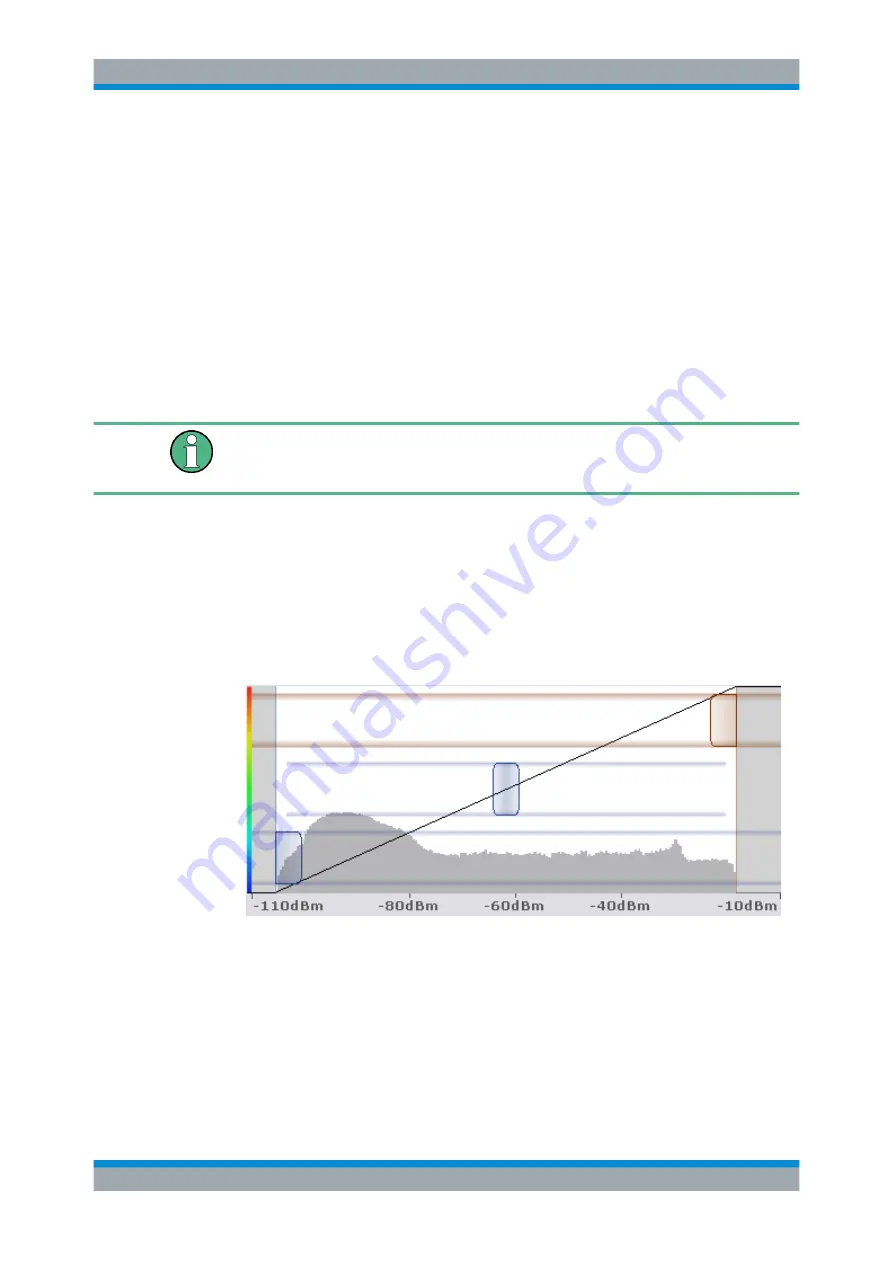
To set the value range graphically using the color range sliders
1. Select and drag the bottom color curve slider (indicated by a gray box at the left of
the color curve pane) to the lowest value you want to include in the color mapping.
2. Select and drag the top color curve slider (indicated by a gray box at the right of
the color curve pane) to the highest value you want to include in the color mapping.
To set the value range of the color map numerically
1. In the "Start" field, enter the percentage from the left border of the histogram that
marks the beginning of the value range.
2. In the "Stop" field, enter the percentage from the right border of the histogram that
marks the end of the value range.
Trace Configuration


