


Screen Elements
R&S
®
ZVA/ZVB/ZVT
1145.1084.12 3.12
E-1
•
Data traces
show the current measurement data and are continuously updated as the
measurement goes on. Data traces are dynamic traces.
•
Memory traces
are generated by storing the data trace to the memory. It represents the state of
the data trace at the moment when it was stored. Memory traces are static traces which can be
stored to a file and recalled.
•
Mathematical traces
are calculated according to a mathematical relation between constants and
the data or memory traces of the active setup. A mathematical trace that is based on the active
data trace is dynamic.
It is possible to generate an unlimited number of memory traces from a data trace and display them
together, see
Data -> Mem
. Markers and marker functions are available for all trace types.
The trace type of each trace in a diagram area is indicated in the trace list. You can also make
each trace
Invisible
without deleting it.
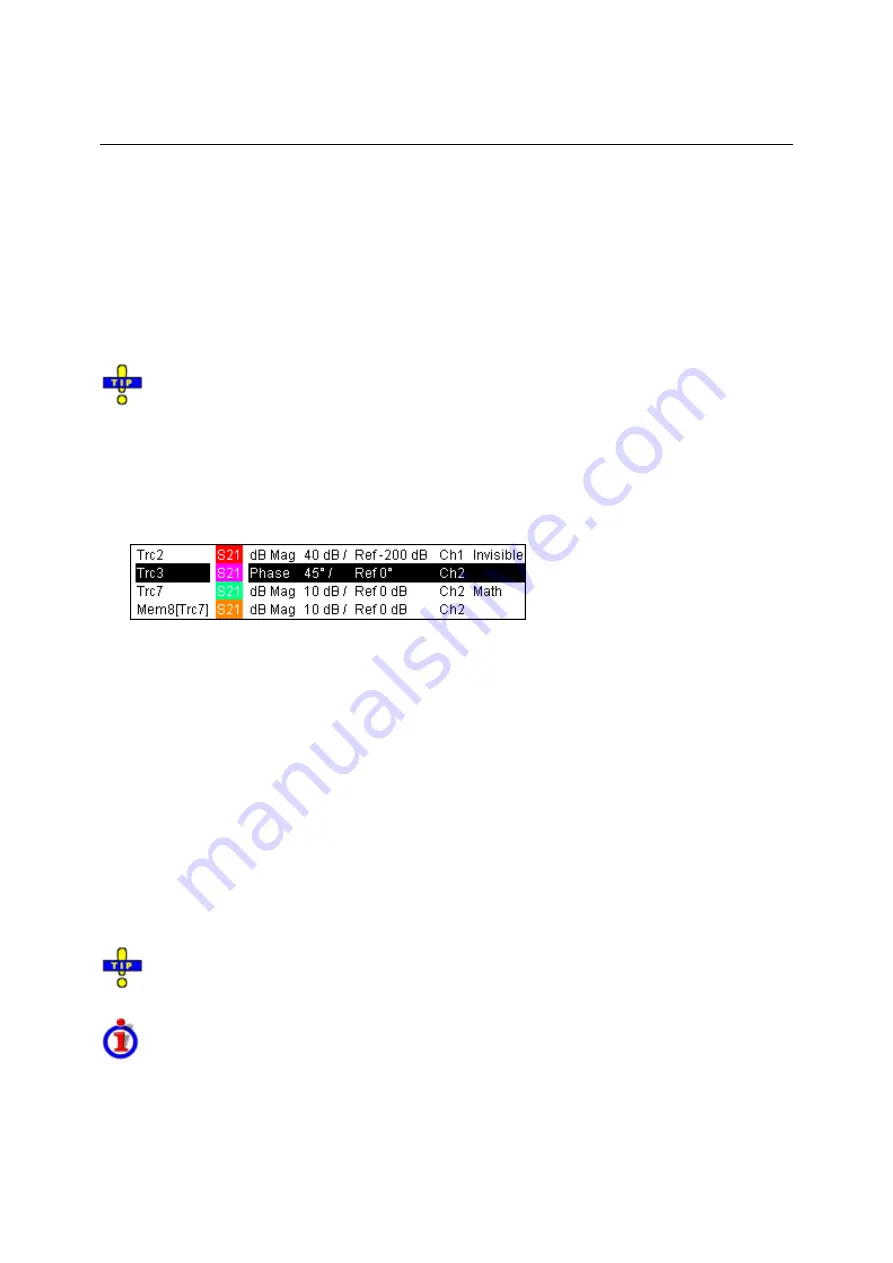
Trace List and Trace Settings
The main properties of all traces assigned to the diagram area are displayed in the trace list in the
upper left corner.
Each line in the trace list describes a single trace. The active trace is highlighted. The lines are divided
into several sections with the following contents (from left to right):
•
Trace name
indicates the current trace name. The default names for new traces are Trc<n>
where <n> is a current number. A
Mem...
preceding the trace name indicates a memory trace.
Right-click the section and call the
Trace Manager
from the context menu to change the trace
name.
•
Measured quantity
indicates the measured quantity, e.g. an S-parameter or a ratio. The
measured quantity of the active trace is also displayed in the diagram area below the trace list.
•
Format
shows how the measured data is presented in the graphical display (trace format).
•
Scale
shows the value of the vertical or radial diagram divisions (Scale Div.) and the Reference
Value.
•
Channel
shows the channel that each trace is assigned to. The channel section is omitted if the
all traces in the diagram area are assigned to the same channel.
•
Type
shows
Invisible
if a trace is hidden and
Math
if the trace is a mathematical trace. Right-click
the trace name and click
Show Data
or
Show Mem
from the context menu to display and hide
data and memory traces. Use the
Trace Funct(ions)
to define mathematical traces.
Right-click any of the sections in the trace list (except
Type)
to open a context menu and access
the most common tasks related to the section.
Context menus of the trace list
A right mouse click on the trace name, the measured quantity, and the format and scale section of the
trace list opens the following context menus, respectively:
Summary of Contents for 1145.1010.04/05/06
Page 10: ......
Page 20: ......
Page 22: ......
Page 48: ......
Page 70: ......
Page 72: ......
Page 90: ......
Page 92: ......
Page 108: ......
Page 156: ......
Page 162: ......
Page 406: ...Display Menu R S ZVA ZVB ZVT 1145 1084 12 4 244 E 6 Stack Tile Horizontally Tile Vertically...
Page 450: ...Status Reporting System R S ZVA ZVB ZVT 1145 1084 12 5 18 E 1...
Page 462: ......
Page 766: ......
Page 772: ......
Page 792: ......
Page 794: ......
Page 808: ......


