18-406
18-406
18.1.12.
Load Data
The data file and log file which were saved in
can be displayed on the graph
by clicking the [
Load Data
] (
) button in the [Oscillograph] tab -> [Data File] group on the ribbon.
18.1.13.
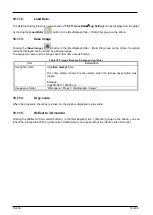
Save Image
Clicking the [
Save Image
] (
) button in the [Oscillograph] tab -> [Data File] group on the ribbon, the graph
currently displayed can be saved as a bitmap image
The image file name and the image save folder name are as follows.
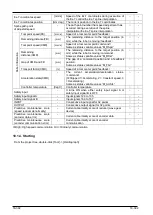
Table 18-7 image filename & Image saving folder
Item
Explanation
Image file name
Img
<time stamp>
.bmp
The <time stamp> shows the time stamp when the [Image save] button was
clicked.
Example
:
Img20130911-183525.csv
Image save folder
“Workspace \ Project \ Oscillograph \ Image”
18.1.14.
Gray scale
When the gray scale checkbox is turned on, the graph is displayed in gray scale.
18.1.15.
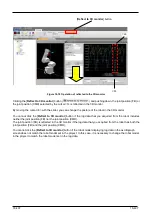
Reflect to 3D monitor
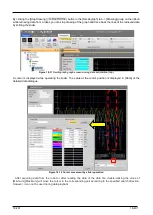
Clicking the [Reflect to 3D monitor] button () in the [Oscillograph] tab -> [Monitor] group on the ribbon, you can
reflect the joint position (FB) or joint position (CMD) which you acquired from the robot on the 3D monitor.
Summary of Contents for 3F-14C-WINE
Page 84: ...8 84 8 84 Figure 8 21 Parameter transfer procedure 1 2 2 ...
Page 393: ...18 393 18 393 Figure 18 1 Starting the Oscillograph ...
Page 413: ...18 413 18 413 Figure 18 24 Output to Robot program Selection ...
Page 464: ...18 464 18 464 Figure 18 72 Starting the Tool automatic calculation ...
Page 545: ...21 545 21 545 Figure 21 55 Hide display of user mechanism ...
Page 624: ...24 624 24 624 Figure 24 4 Document output example ...

