18-399
18-399
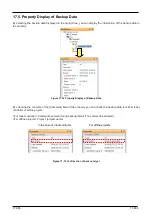
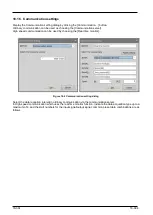
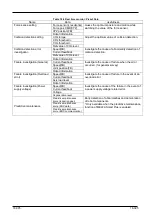
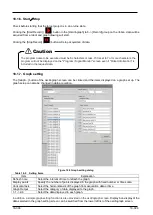
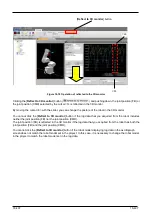
Figure 18-6 Switch of display/non-display of graph
You can change the graph drawing interval during data recording using the [Refresh time] drop-down list and the
number of display points displayed on the graph in the [Display points] drop-down list. The number of points to
display can be changed only by slider operation.
By using the [<-] [->] key on the keyboard, you can fine-tune the display range (horizontal axis) while looking at
the graph.
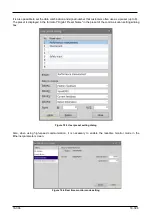
Figure 18-7 Switch of [
Refresh time] / [Display points]
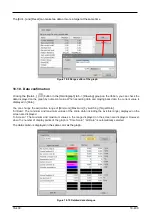
18.1.8. Graph range setting
The [Range...] button of the oscillograph screen can be clicked and the display ranges of the vertical data axes
set. When [Auto adjust] is checked, the display ranges of the vertical axes in the graph are automatically
adjusted.
Figure 18-8 Graph range setting dialogue
Summary of Contents for 3F-14C-WINE
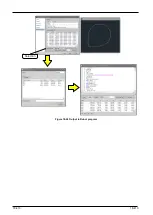
Page 84: ...8 84 8 84 Figure 8 21 Parameter transfer procedure 1 2 2 ...
Page 393: ...18 393 18 393 Figure 18 1 Starting the Oscillograph ...
Page 413: ...18 413 18 413 Figure 18 24 Output to Robot program Selection ...
Page 464: ...18 464 18 464 Figure 18 72 Starting the Tool automatic calculation ...
Page 545: ...21 545 21 545 Figure 21 55 Hide display of user mechanism ...
Page 624: ...24 624 24 624 Figure 24 4 Document output example ...

