CENTER SCREEN AREA / IMAGE CONTAINERS - …
LSM 710 and LSM 780
Carl Zeiss
Raster Scanning Image Correlation Spectroscopy
Systems
254 M60-1-0025
e
02/2010
If
Table
,
Image
or
Diagram
was selected from the
Representation
pull down menu, the 2D image will
be exported. If 2.5 D was selected, a pseudo 3D image will be stored. If the Show residuals box is
checked, the Residuals will be displayed in a format as selected in the
Representation
pull down menu
(Fig. 287). By activating this box the
Hide G(0)
error check box becomes available as well. Check the box
in order to omit the zero spatial correlation value to be included in the fit.
Pressing the export button below the
Hide G(0)
box will export the residuals image. If
Table
,
Image
or
Diagram
was selected from the
Representation
pull down menu, the 2D image will be exported. If 2.5
D was selected, a pseudo 3D image will be stored. Activating / Deactivation the
Show image
check box
will display or remove the intensity image from the
Center image
window.
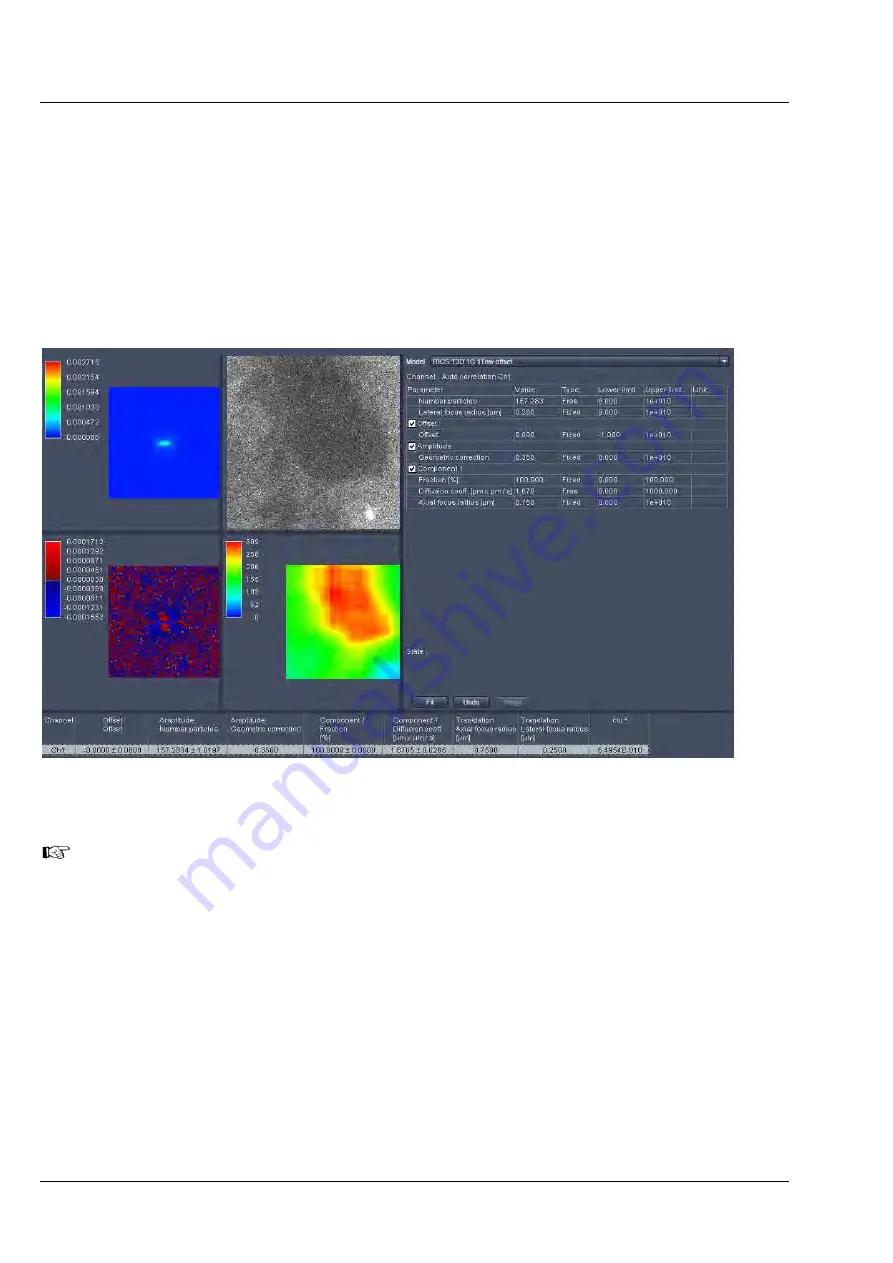
Fig. 294
Center Image window displaying Fit image, Intensity image, Fit table, Residuals Image, Map and Result
table (from top left to bottom right)
Note that the
Draw scaling bar
,
Use image palette
and
Hide G(0)
check boxes will only be
available in the RICS
Show all
mode. To activate the
Show all
mode activate the RICS
Show
all
button on the
View Control
bar.
If the
Show map
box is checked, a map, if being created before, will be displayed and the map options
will be visible. In the
Region in Pixels
input box you determine the size of the region in an m x m format
to be used for mapping the intensity image. This size should naturally be smaller than the image size, but
it is recommended not to fall below 64 x 64 pixels to obtain enough signal-to-noise ratio (SNR).
If you press the
Settings
button, the settings menu will pop up (Fig. 295).


