LSM 710 and LSM 780
CENTER SCREEN AREA / IMAGE CONTAINERS - …
Systems
FRET View
Carl Zeiss
02/2010 M60-1-0025
e
235
6.16.1
Tools in the FRET View Options
Control Block for Acceptor
Photobleaching
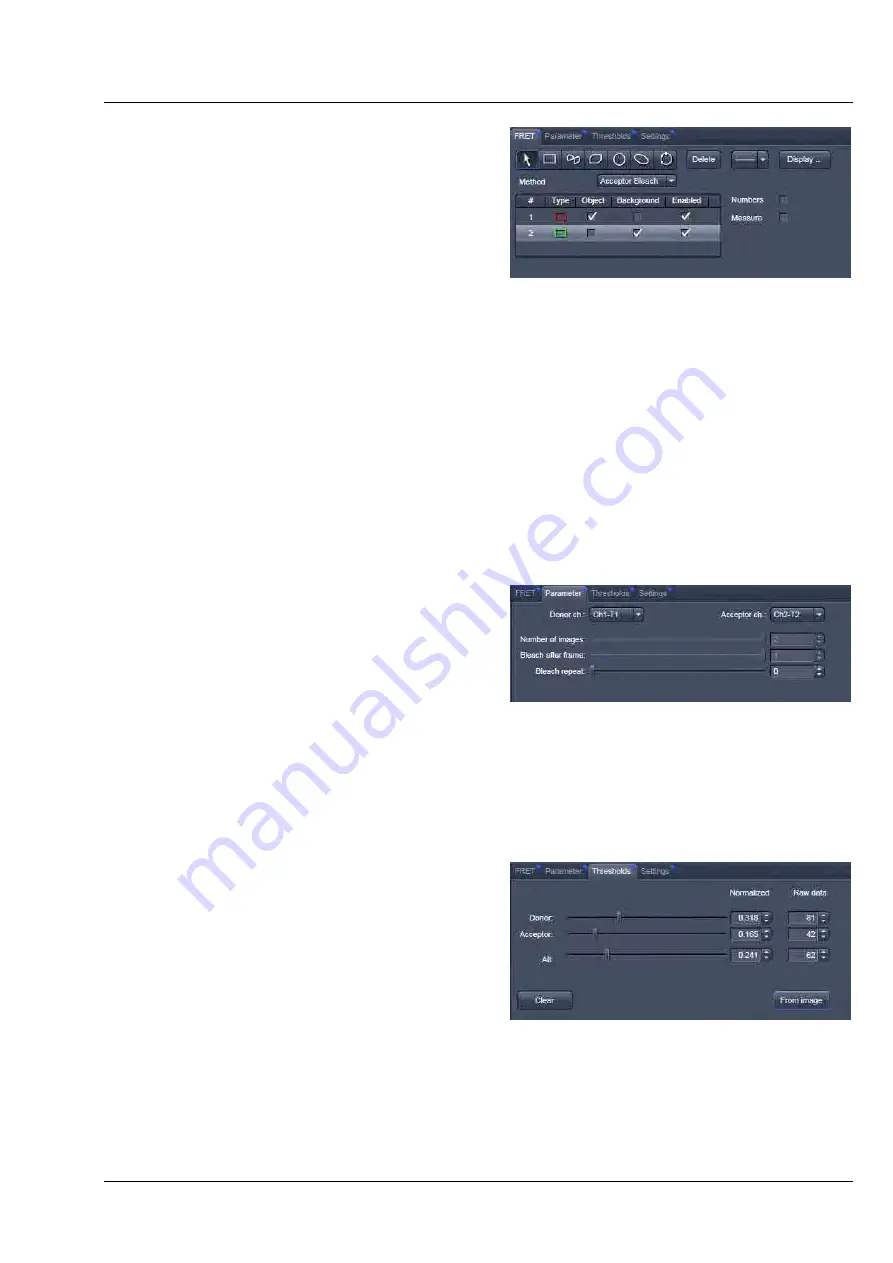
FRET tab (Fig. 261):
Within this tab the overlay regions present in the
image (used for bleaching and defined as
background or control region) can be defined (The
drawing tools correspond to the drawing tools
described in section
Overlay
).
As
Method
for FRET Analysis, only
Acceptor
Photobleach
is available in the drop down list.
The check boxes
Numbers
and
Measure
refer to the overlay regions and annotate the number of the
region and its area to the overlay in the image.
Export
allows the resulting FRET image to be saved as a separate image file.
The regions defined can be set as
Object
(Region where FRET should be calculated) or
Background
(from which the threshold for the image analysis can be deduced from).
Regions and the assigned status as Object or Background can be selected or deselected for the individual
Analysis using the corresponding check box under
Enabled
.
Parameter tab (Fig. 262):
In case the image series for Acceptor
Photobleaching has not been acquired with the
FRETplus Macro, various Parameters of the image
series can be set in this tab.
The image of the Donor and the Acceptor are
assigned to the appropriate channel using the
drop down menu next to
Donor ch.:
and
Acceptor ch.:
.
The total
Number of images
, the time for the bleaching event (
Bleach after frame
), and the action of
Bleach repeat
is set using the slider next to each action or by editing the field next to the slider.
Thresholds tab (Fig. 263):
The threshold for the image analysis can be set
manually using the slider or editing text box next
to
Donor
,
Acceptor
or
All
, where
All
moves both
sliders to the same value.
Alternatively, the threshold can be set from the
image when clicking
From image
provided a
background region and an object region have been
defined and enabled in the FRET tab.
The values for the thresholds are either displayed
as grey value levels (
Raw data
) or
Normalized
to
the value 1.
Fig.
261
FRET View Options Control Block,
FRET tab
Fig.
262
FRET View Options Control Block,
Parameter tab
Fig.
263
FRET View Options Control Block,
Thresholds tab


