CENTER SCREEN AREA / IMAGE CONTAINERS - …
LSM 710 and LSM 780
Carl Zeiss
Raster Scanning Image Correlation Spectroscopy
Systems
248 M60-1-0025
e
02/2010
6.18.3
Correlation Functionalities
Activate
Correlation
under the
RICS
view. The Correlation options will be displayed in the View control
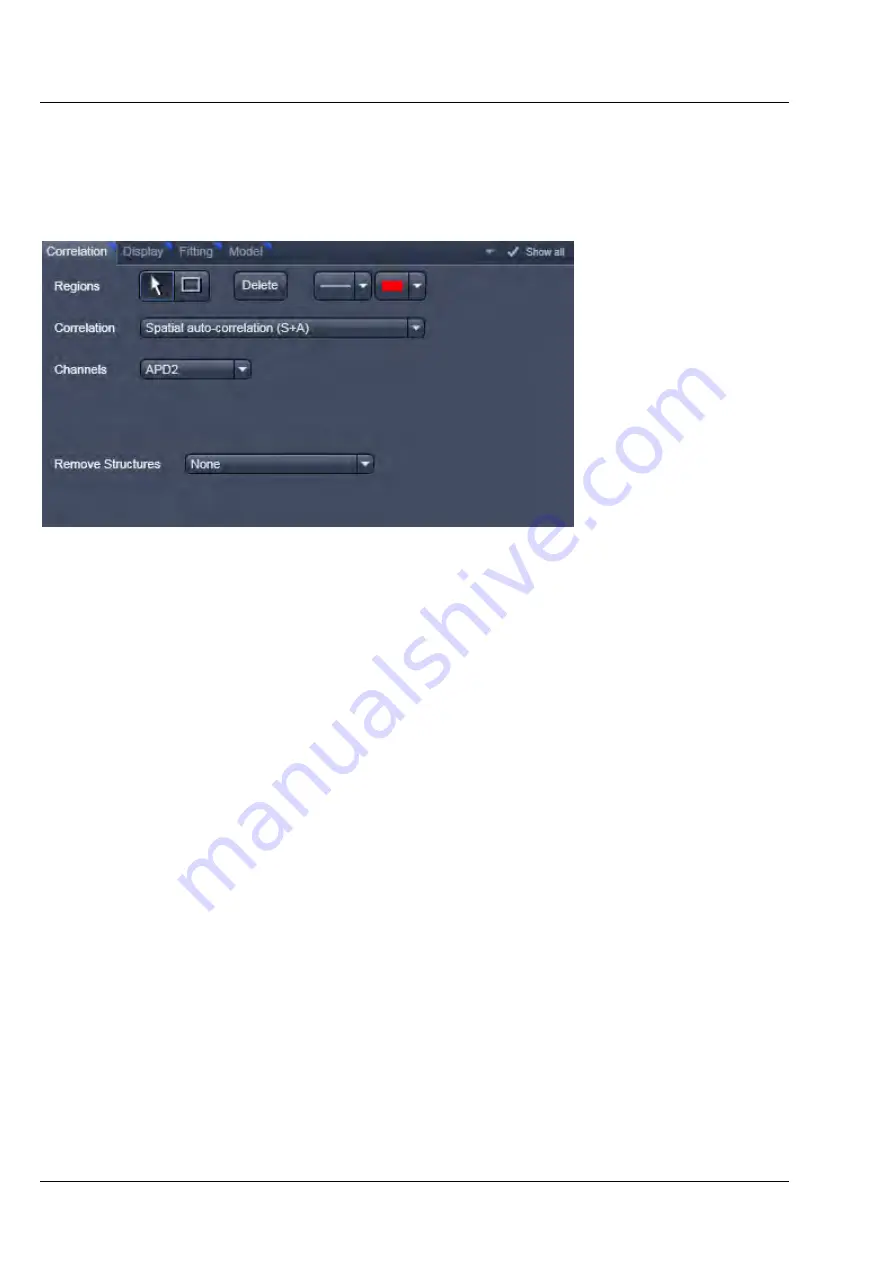
window (Fig. 278).
Fig. 278
Correlation control window
Regions
allow you to draw regions of interest (ROI) within the intensity image. Activate the
Rectangle
button and draw a region within the intensity image by holding down the left mouse button. Any
rectangular shaped region can be drawn. The correlation will be newly computed taken into account
now only the ROI.
If the
Arrow
button is active, the ROI can be moved around the image by drag and drop. If the
Arrow
button is deselected, a new ROI will be drawn.
For each ROI a correlation image will be computed (Fig. 279). You can view each correlation by selecting
the respective row in the
Result
table at the bottom. It is not possible to view two correlation images at
the same time.
If a ROI is selected with the Arrow button active, then pressing the
Delete
button will remove the ROI
from the intensity image.
With the
Line
button you can select the line width and with the Color rectangle button the color of a
selected ROI via drop down menus.


