Monitor
RTA (Real Time Analyzer)
160
RIVAGE PM10 Operation Manual
RTA (Real Time Analyzer)
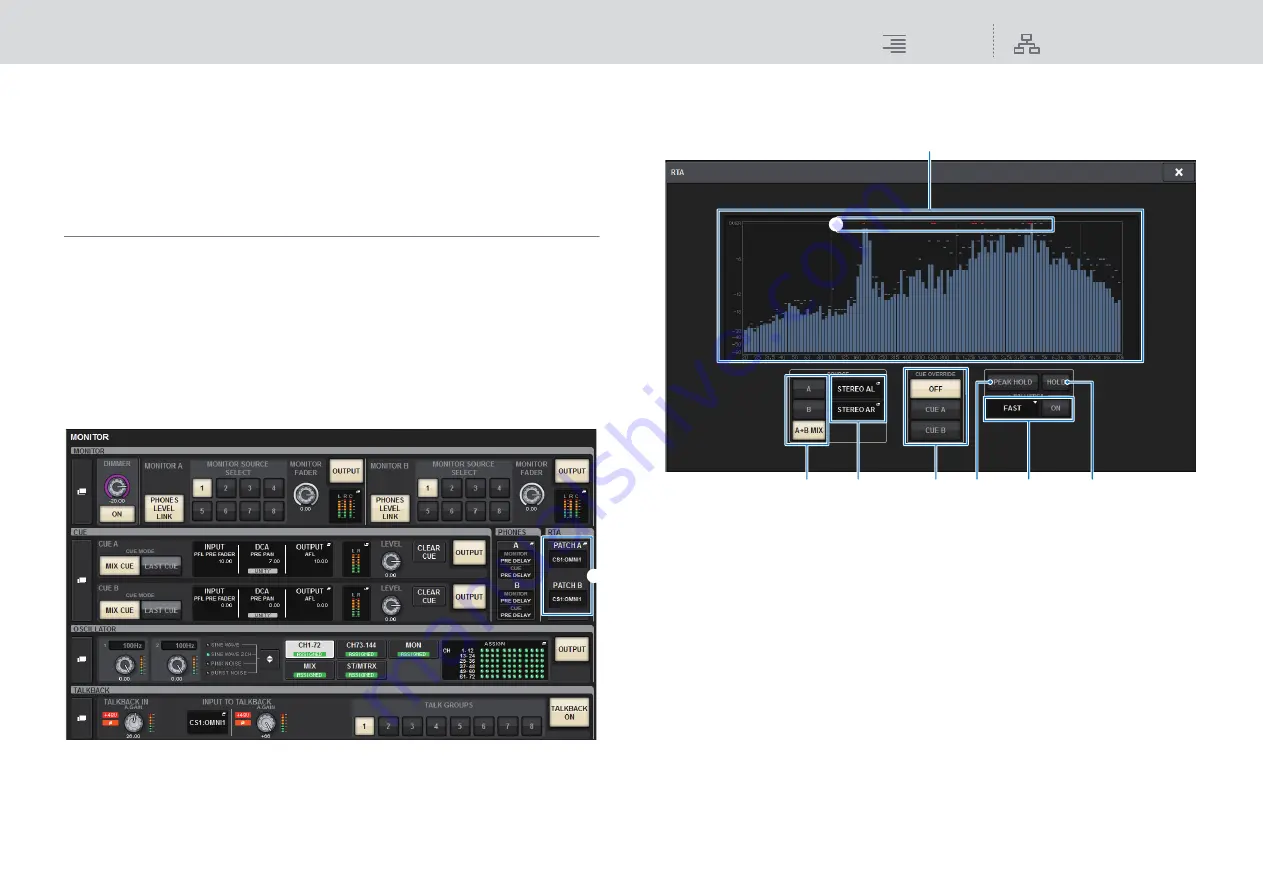
The RIVAGE PM10 features a real time analyzer (RTA), which provides visual feedback of the
frequency spectrum of cued sources for 1/12 octaves (121 bands).
The RTA accepts a single-channel signal, and enables you to switch between inputs A and B. If you
select A+B MIX, the signal with higher levels will be displayed.
Using the Real Time Analyzer
There are four ways to access the RTA.
• Using a popup window dedicated to the RTA
• Using the HPF/EQ popup window for the channel parameters
• Using the popup window for the inserted GEQ
• Using the popup window for the inserted PEQ
■
Using a popup window dedicated to the RTA
1.
Press the MONITOR button on the menu bar to access the MONITOR screen.
1
RTA popup display buttons
Indicate the name of ports assigned to RTA A and RTA B. If CUE OVERRIDE is on, these
buttons will indicate the name of cues set by CUE OVERRIDE. Press these buttons to access
the RTA popup window, in which you can make detailed RTA settings.
2.
Press the RTA popup button to access the RTA popup window.
RTA popup window
1
Frequency response graph
The frequency response graph indicates the result of frequency analysis by 1/12 octave bands.
2
OVER indicators
If data exceeds 0 dB, OVER indicators will appear.
3
CUE OVERRIDE button
The frequency response of the cue signal selected here will be displayed in the graph.
4
INPUT PATCH popup button
Press this button to display a popup window, in which you can select a signal that will be input
to the RTA.
5
Input switch buttons
You can select A, B, or A+B MIX as the input channel displayed on the RTA graph. If you select
A+B MIX, signals A and B will be compared and the signal with higher levels will be displayed.
6
PEAK HOLD
If this button is on, the analyzed frequency response graph will hold the peak level indication.
1
2
4
5
3
8
1
7
6


