LSM 880
Left Tool Area and Hardware Control Tools
ZEISS
10/2014 V_01
000000-2071-464
277
(3)
Pulse distance histogram
This diagram shows the frequency plotted against the times elapsed between two subsequent pulses (or:
photons recorded from the detector). To obtain this histogram, the time distance between two photons
is evaluated from the raw data.
You can zoom in the image by pressing the left mouse button and drawing a rectangle of the area you
want to zoom in. If the button is disengaged, the zoom image is displayed.
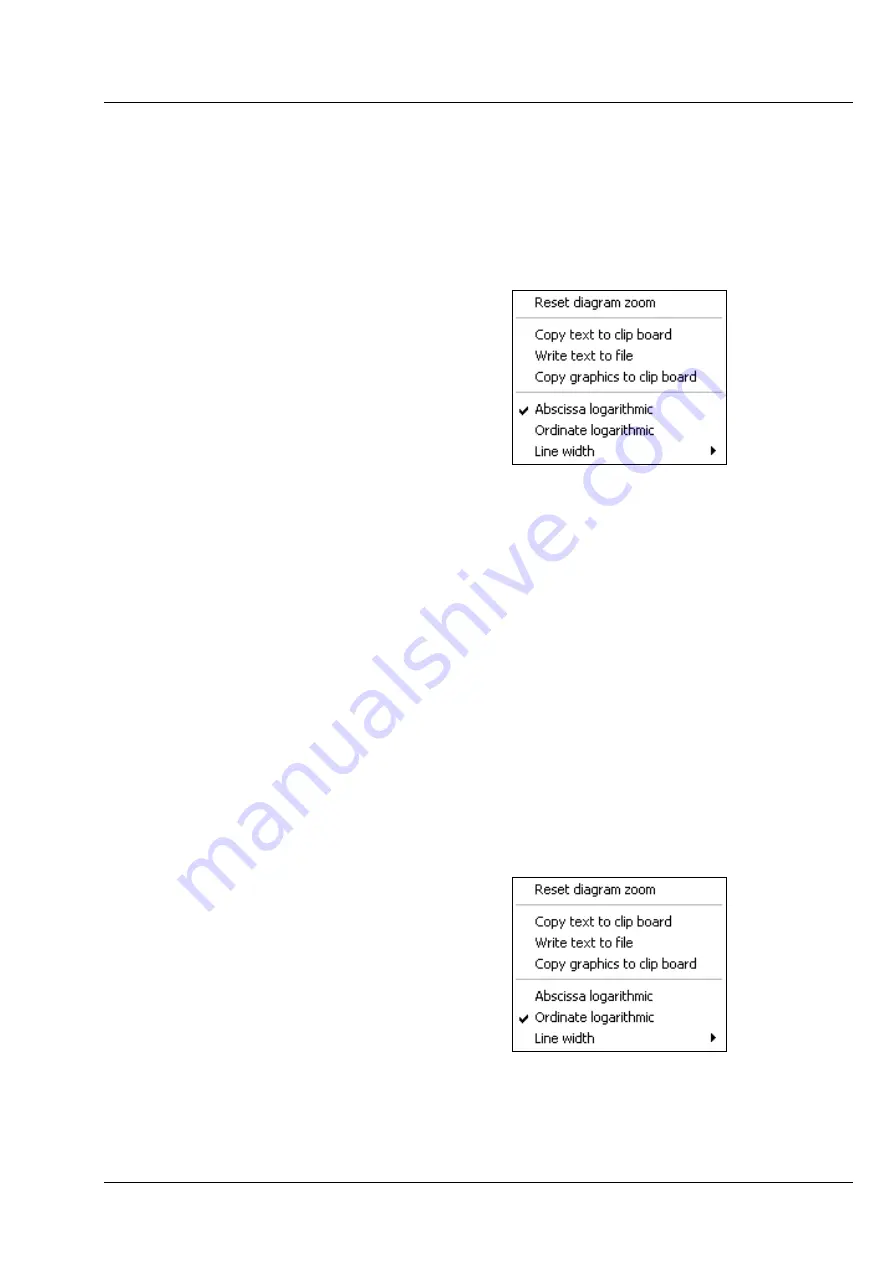
By clicking the right mouse button you can choose
between different options in the
Pulse Distance
Histogram
context menu (Fig. 369).
•
Reset diagram zoom
will reset any zoomed
image.
•
Copy text to clipboard
will copy the diagram
coordinates into the clipboard, from which they
can be pasted into other programs like Excel.
Write text to file
will store the diagram
coordinates in a .txt file. You will be prompted
to choose a name and a folder before saving.
•
Choosing
Abscissa logarithmic
or
Ordinate logarithmic
will display the abscissa or ordinate in a
logarithmic scaling.
•
The
line width
allows you to select the thickness of the graph. 6 settings are possible.
(4)
Photon counting histogram
This diagram (also called Photon Counting Histogram) shows the frequency plotted against the photon
number in a certain time bin. To obtain this histogram, the number of pulses (or: photons recorded from
the detector) in a moving time window are recorded and included in a histogram. You can determine the
binning time in the
Measure
tool in
Processing
under PCH or if you load a raw data file with the
Reload
button.
You can zoom in the image by pressing the left mouse button and drawing a rectangle of the area you
want to zoom in. If the button is disengaged, the zoom image is displayed.
By clicking the right mouse button you can choose
between different options in the
Pulse density
Histogram
context menu (Fig. 370).
•
If you have zoomed in, you can go to the
original image size by choosing the
Reset
diagram zoom
option.
•
Copy text to clipboard
will copy the diagram
coordinates into the clipboard, from which they
can be pasted into other programs like Excel.
•
Write text to file
will store the diagram
coordinates in a .txt file. You will be prompted
to choose a name and a folder before saving.
Fig. 369
Pulse Distance Histogram context
menu
Fig. 370
PCH context menu
Summary of Contents for LSM 880
Page 1: ...LSM 880 LSM 880 NLO Operating Manual October 2014 ZEN 2 black edition...
Page 650: ......
Page 678: ......
Page 687: ......
Page 688: ......


