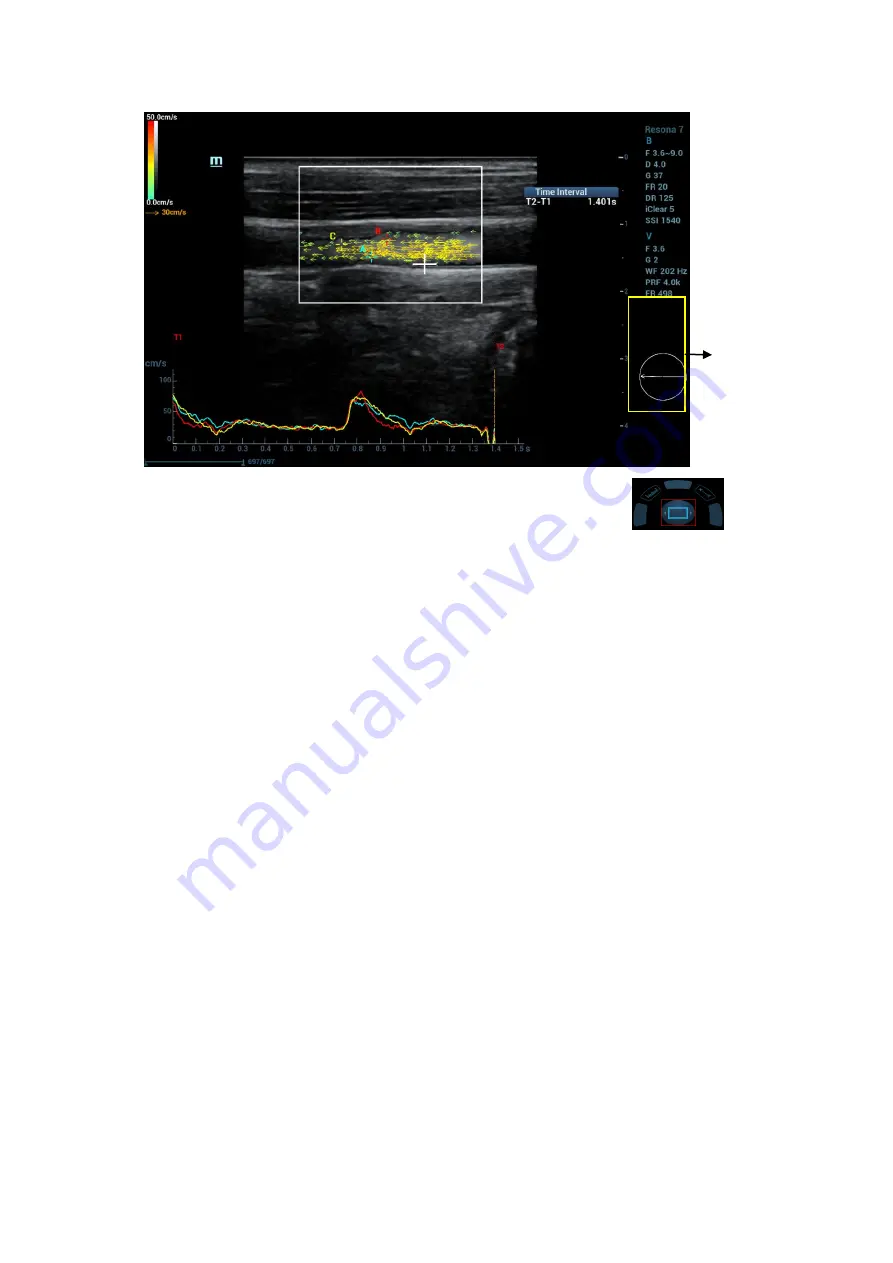
5-24 Image Optimization
3. Press <Cursor>. The trackball indication changes to cine-play indication
. Move the
trackball to replay the V Flow cine. The speed and the direction of the vector graphics changes with
the time.
ROI speed-time curve
After the V Flow capturing is completed, a smaller ROI appears inside the original ROI to calculate the
arrangement of spatial speed and the maximum speed-time curve.
1. Capture the image. Follow 1-5 procedure in 5.6.1.
2. Tap [Speed ROI] on the touch screen, rotate the knob under the [ROI Size] on the touch screen, or
rotating the track ball and pressing <Cursor> key to adjust ROI size and position.
A purple dot appears inside the smaller ROI indicating the maximum speed position. The maximum
speed-time curve appears at the bottom of the screen. (The speed of purple dot changes with the
time. Besides, X-axis represents the time; Y-axis represents the speed. The ROI speed-time curve
appears in purple.)
The result box shows the speed values of the smaller ROI. Max, T-Max, Mean, TAMean, Median,
Turbulen and Size refer to maximum speed of the current frame, maximum speed of all the frames
during T1~T2 time, average speed of the current frame, average speed of all the frames during
T1~T2 time, median speed of the current frame, blood flow dispersion of the current frame and ROI
size.
Move the smaller ROI. The ROI speed-time curve and the values in the result box are updated in
real time.
Vector
graphics


