


Page 18-21
L
@)STAT
@PLOT @SCATR
produce scattergram of y vs. x
@STATL
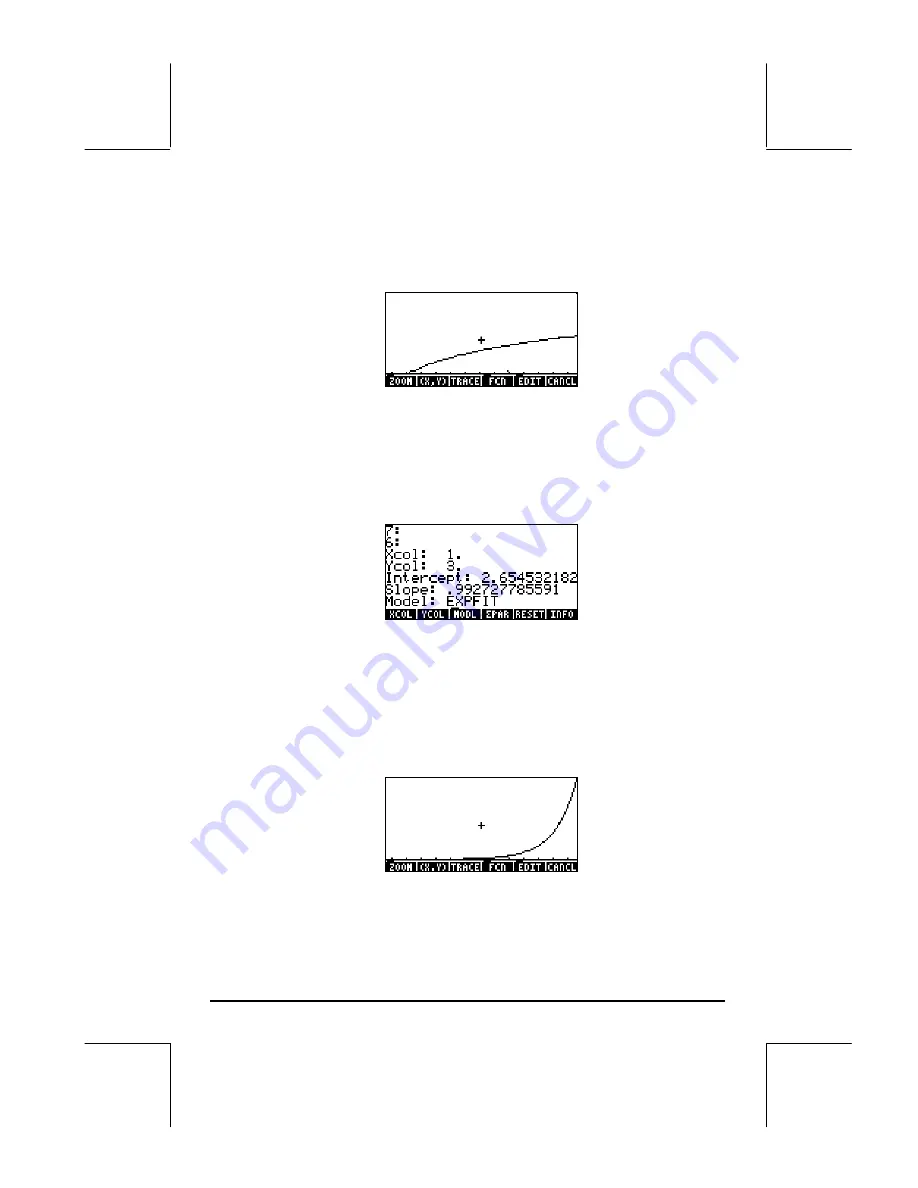
show line for log fitting
Obviously, the log-fit is not a good choice.
@CANCL
returns to normal display.
•
Select the best fitting by using:
@)STAT
@£PAR
@)MODL
@BESTF
shows EXPFIT as the best fit for these data
L
@)STAT
@)FIT
@£LINE
produces
'2.6545*EXP(0.9927*X)'
@CORR
produces 0.99995… (good correlation)
2300
@PREDX
produces
6.8139
5.2
@PREDY
produces
463.37
L
@)STAT
@PLOT @SCATR
produce scattergram of y vs. x
@STATL
show line for log fitting
•
To return to STAT menu use:
L
@)STAT
•
To get your variable menu back use:
J
.
Содержание 49g+
Страница 1: ...hp 49g graphing calculator user s guide H Edition 4 HP part number F2228 90006 ...
Страница 197: ...Page 5 30 LIN LNCOLLECT POWEREXPAND SIMPLIFY ...
Страница 377: ...Page 11 55 Function KER Function MKISOM ...
Страница 457: ...Page 13 26 In the right hand side figure above we are using the line editor to see the series expansion in detail ...
Страница 775: ...Page 26 10 the location of the backup battery in the top compartment at the back of the calculator ...
Страница 838: ...Page L 5 ...