4
4 - 1
4. CHECKING THE RESULT
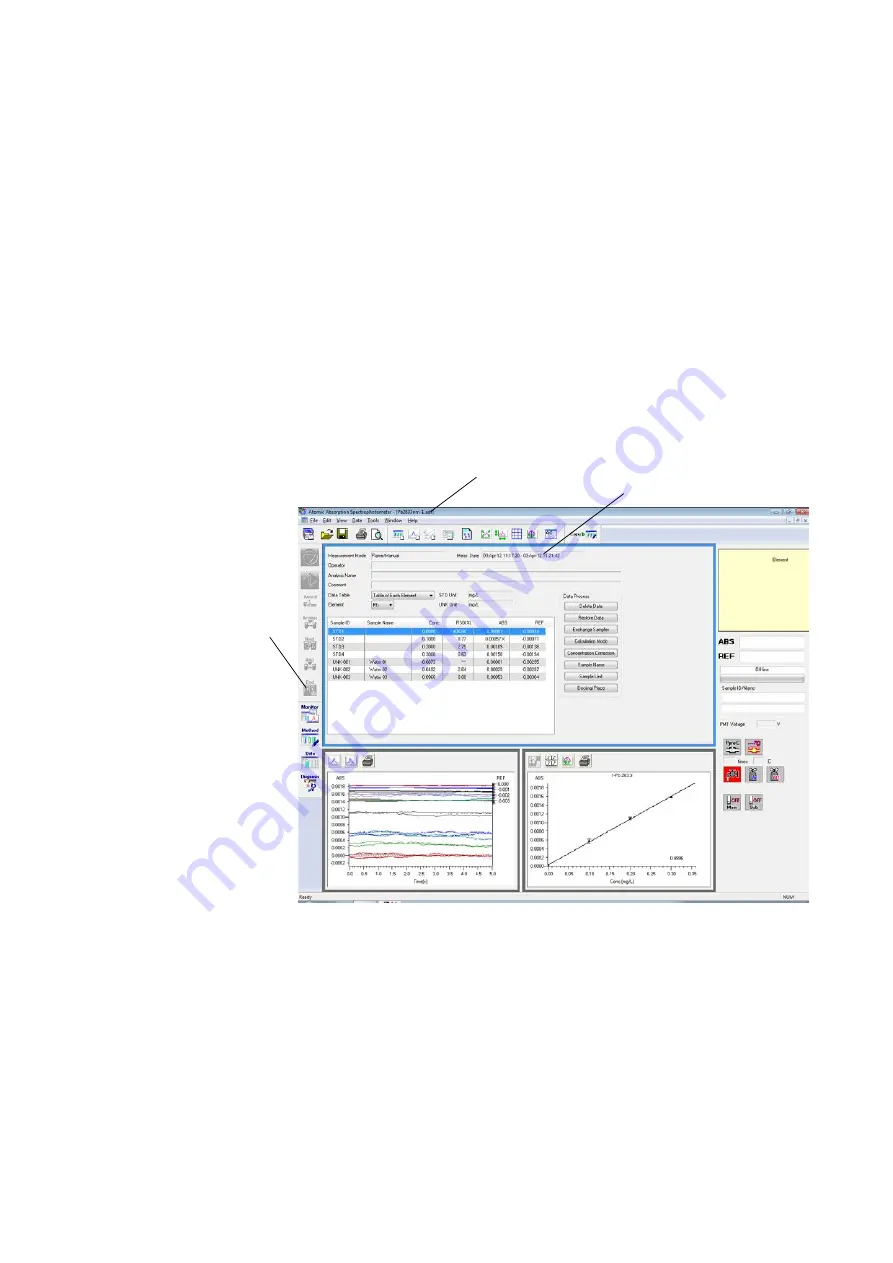
When you click the [Close Sequence] button (<1> in Fig. 4-1),
display changes to the Data Process window where editing,
printing, saving, etc. of measurement result can be selected.
When automatic saving of analysis results is selected, the
analysis results are saved as a file at this point.
The Data Process window is composed mainly of Data Table,
Profile Graph, Working Curve Graph and Instrument Monitor Bar
(commonly used with Monitor window).
As for Data Table, Profile Graph and Working Curve Graph,
display area can be changed in size by dragging the boundary
line with the mouse.
Fig. 4-1 Data Process Window
In the Data Process window, the date of measurement (<2> in
Fig. 4-1) is displayed, and at the date and time of measurement
end, a temporary file name of Resultyyyy_mmdd_hhmm_ss.adf
is posted on the window title bar (<3> in Fig. 4-1).
<3>
<2>
<1>
Содержание ZA3000 Series
Страница 267: ...3 1 11 3 43 Fig 3 31 Parameter List Window Common conditions The setting of method is thus completed ...
Страница 357: ...5 5 Twin Injection 5 28 Fig 5 24 Dialog Box for Confirming Nozzle Position 7 Click Start measurement ...
Страница 423: ...9 3 5 9 11 Fig 9 14 Diagnosis Log Dialog Box ...
Страница 449: ...10 5 Reflecting on Analysis Conditions 10 24 Fig 10 16 Method Window Unmark the checkbox ...
Страница 455: ...INDEX 4 V Verify 3 34 W Working curve graph 4 1 Wavelength accuracy 9 1 ...
Страница 456: ...INSTRUCTION MANUAL 7J1 9027 000 Ver 1 February 2016 MODEL HFS 4 HYDRIDE FORMATION SYSTEM ...


