Section 6: Clarius
Model 4200A-SCS Parameter Analyzer Reference Manual
6-204
4200A-901-01 Rev. C / February 2017
4. Select
Properties
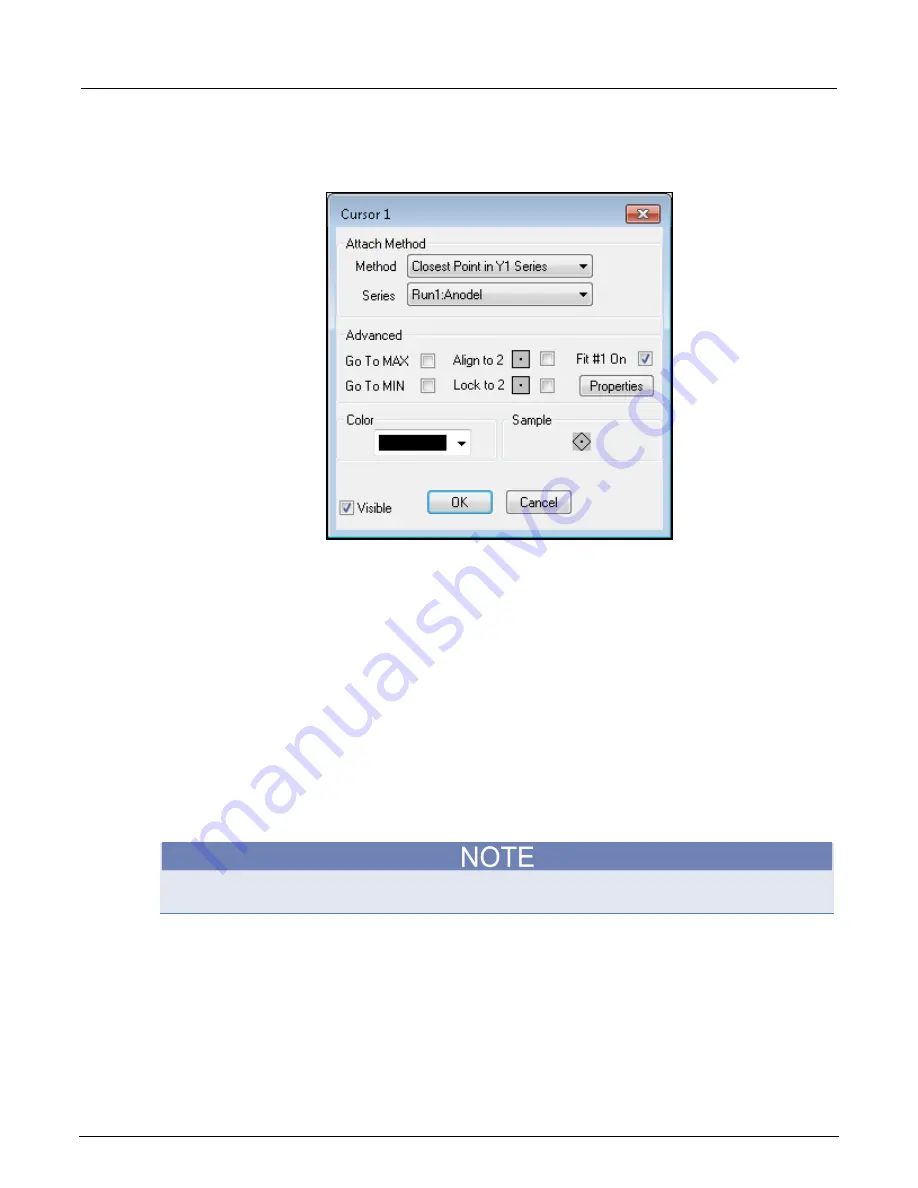
. The Cursor dialog box for the selected cursor opens, as shown below. The
Sample
area displays the cursor that you are configuring, including the color.
Figure 362: Cursor # dialog box
5. Select the
Attach Method
. You can choose:
Free Floating
Closest Point in Any Series:
Allows you to attach the selected cursor to any plot on the
graph.
Closest Point in Y1 Series
: Only allows you to attach the selected cursor to the specific
Y1
axis plot that is selected for
Series
.
Closest Point in Y2 Series:
Only allows you to attach the selected cursor to the specific Y2
axis plot that is selected for
Series
.
6. If you selected a
Closest Point in Series
option, select
Series
and choose the plot to which you
want the attach the cursor.
7. Select the
Color
for the cursor.
8. If you do not want the cursor to display immediately, clear
Visible
. You can restore the cursor
later — the cursor keeps its configuration.
9. Click
OK
. If Visible is selected, the cursors and their related text blocks are displayed on the
graph.
When you first display the cursors, the default location of the cursors is at the origin, and the default
location of the cursor coordinate text block is in the lower right corner of the graph.
Position cursors on the graph
To position cursors:
1. Drag the cursor to its position on the graph.
2. If you selected
Closest Point in Any Series
and the cursor is not on the correct point, drag the
cursor from the present point to the correct point until it attaches to the point. On the correct point,
drag the cursor to the correct position.


