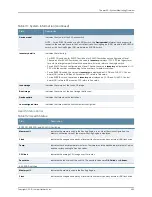
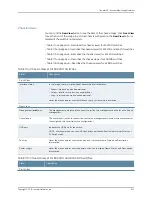

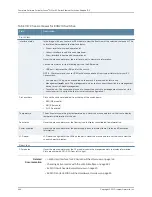

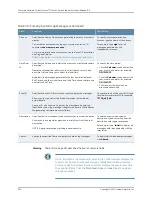
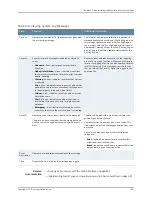
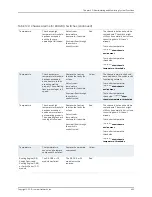
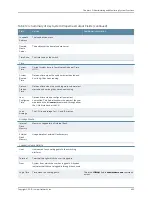


Table 120: Viewing System Log Messages
Additional Information
Function
Field
The information displayed in this field is different for
messages generated on the local Routing Engine than
for messages generated on another Routing Engine
(on a system with two Routing Engines installed and
operational). Messages from the other Routing Engine
also include the identifiers
re0
and
re1
to identify the
Routing Engine.
Displays the name and ID of the process that generated
the system log message.
Process
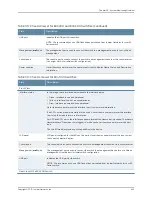
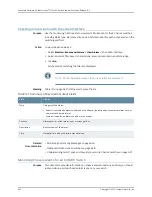
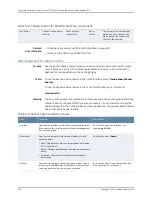
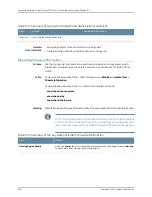
A severity level indicates how seriously the triggering
event affects switch functions. When you configure a
location for logging a facility, you also specify a severity
level for the facility. Only messages from the facility
that are rated at that level or higher are logged to the
specified file.
Severity level of a message is indicated by different
colors.
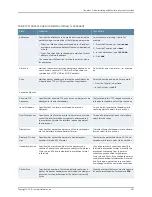
•
Unknown
—Gray—Indicates no severity level is
specified.
•
Debug/Info/Notice
—Green—Indicates conditions
that are not errors but are of interest or might warrant
special handling.
•
Warning
—Yellow—Indicates conditions that warrant
monitoring.
•
Error
—Blue—Indicates standard error conditions that
generally have less serious consequences than errors
in the emergency, alert, and critical levels.
•
Critical
—Pink—Indicates critical conditions, such as
hard-drive errors.
•
Alert
—Orange—Indicates conditions that require
immediate correction, such as a corrupted system
database.
•
Emergency
—Red—Indicates system panic or other
conditions that cause the switch to stop functioning.
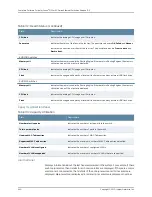
Severity
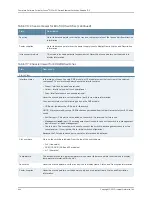
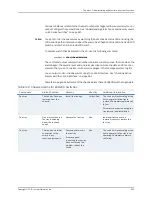
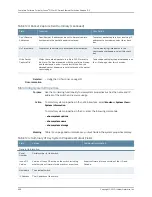
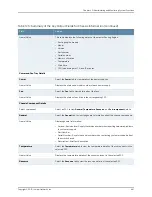
The event ID begins with a prefix that indicates the
generating software process.
Some processes on a switch do not use codes. This
field might be blank in a message generated from such
a process.
An event can belong to one of the following type
categories:
•
Error
—Indicates an error or failure condition that
might require corrective action.
•
Event
—Indicates a condition or occurrence that does
not generally require corrective action.
Displays a code that uniquely identifies the message.
The prefix on each code identifies the message source,
and the rest of the code indicates the specific event or
error.
Event ID
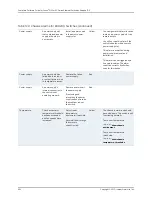
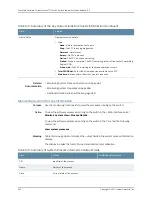
Displays a more detailed explanation of the message.
Event
Description
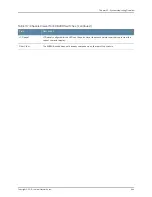
Displays the time at which the message was logged.
Time
Related
Documentation
Checking Active Alarms with the J-Web Interface on page 652
•
•
Understanding Alarm Types and Severity Levels on EX Series Switches on page 637
651
Copyright © 2010, Juniper Networks, Inc.
Chapter 40: Administering and Monitoring System Functions
Summary of Contents for JUNOS OS 10.3 - SOFTWARE
Page 325: ...CHAPTER 17 Operational Mode Commands for System Setup 229 Copyright 2010 Juniper Networks Inc ...
Page 1323: ...CHAPTER 56 Operational Mode Commands for Interfaces 1227 Copyright 2010 Juniper Networks Inc ...
Page 2841: ...CHAPTER 86 Operational Commands for 802 1X 2745 Copyright 2010 Juniper Networks Inc ...
Page 3367: ...CHAPTER 113 Operational Mode Commands for CoS 3271 Copyright 2010 Juniper Networks Inc ...
Page 3435: ...CHAPTER 120 Operational Mode Commands for PoE 3339 Copyright 2010 Juniper Networks Inc ...
Page 3529: ...CHAPTER 126 Operational Mode Commands for MPLS 3433 Copyright 2010 Juniper Networks Inc ...