OPERATION IN EXPERT MODE
LSM 510
DuoScan
Carl Zeiss
Display and Analysis of Images
LSM 510 META
DuoScan
4-286
B 45-0021 e
03/06
4.13.21.2 Function
Elements
The
Profile
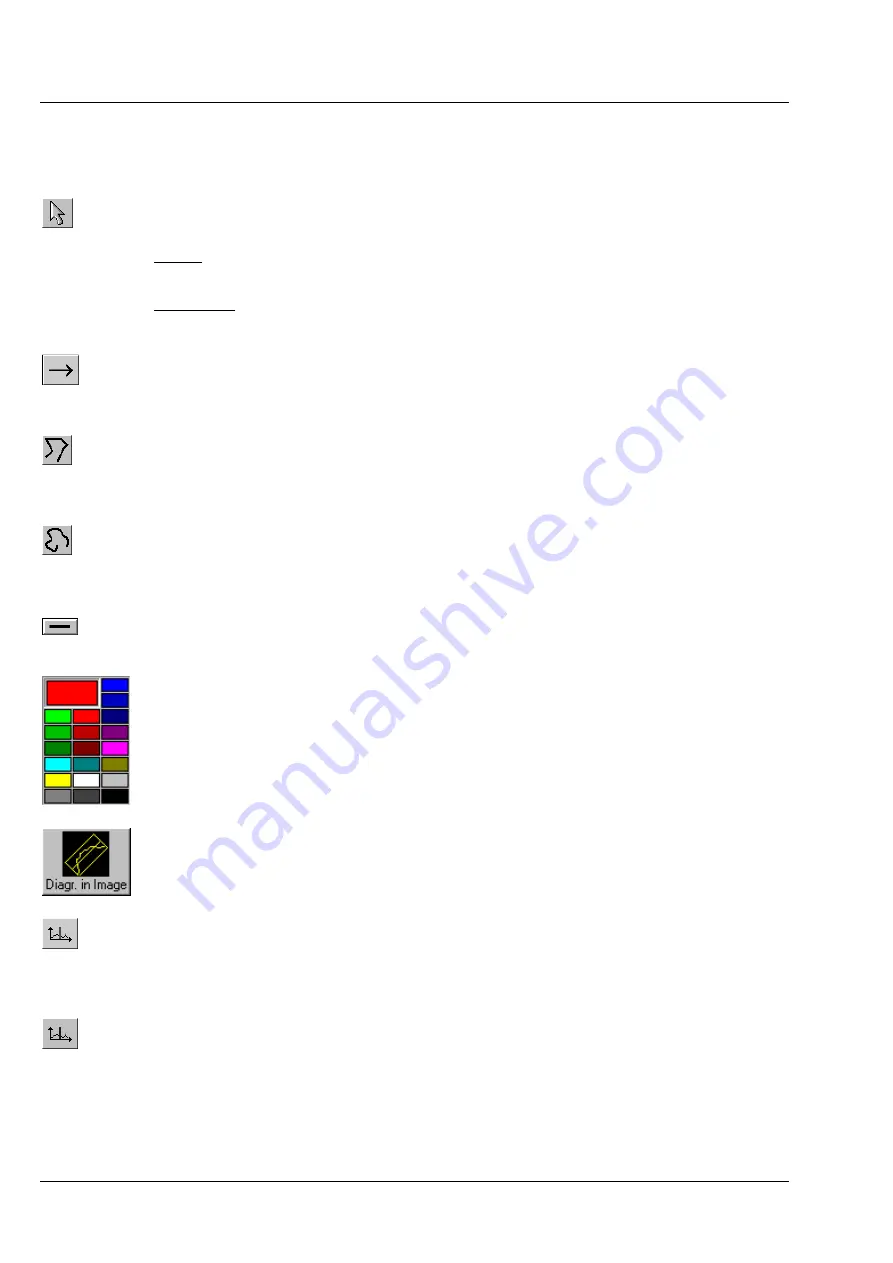
toolbar contains the following function elements:
Arrow
(selection)
button: Activates the mouse button for selection, resizing or movement
of the profile line in the
Image Display
window.
Resize: Click on handle and hold down the mouse button, move the handle, release
mouse button.
Movement: Click on line and hold down the mouse button, move the entire line, release
mouse button.
Line with arrow
button :(open arrow): Activates the straight profile drawing mode.
Click into the image and hold the mouse button, drag a line in any direction and release
the mouse button to end the procedure.
Open polyline
button: Activates the open polyline drawing mode.
The first click into the image sets the starting point, each additional click adds a further
line, right mouse click ends the procedure.
Open free-shape curve
button: Activates the Bezier figure drawing mode.
The first click into the image sets the starting point, each additional click adds a point,
right mouse click ends the procedure.
Line
button: This button allows you to determine the line thickness of the profile line. It
has no influence on the way the intensity profile is generated.
Color
selection box: The colors displayed in the
Color
selection box can be assigned to
the overlay profile line with a click of the mouse. The currently selected color is displayed
in the larger rectangle (top left) of the selection box.
Diagr. In Image
button: The profile diagram is displayed in the image along the drawn
profile line.
Marker 1
button (red): Activates the red marker for movement in the profile diagram;
the marker shown as a red line in the diagram can now be moved to the right or left of
the diagram using the mouse. The marker in the image display (red circle) follows
accordingly.
Marker 2
button (blue): Activates the blue marker for movement in the profile diagram;
the marker shown as a blue line in the diagram can now be moved to the right or left of
the diagram using the mouse. The marker in the image display (blue circle) follows
accordingly.


