Displaying Light Distribution
197
❚❘❘
Cutoff Values
Use the cutoff values to set graphing thresholds. Use
the following thresholds to bracket a region of
interest for bringing out more differentiation in a
surface.
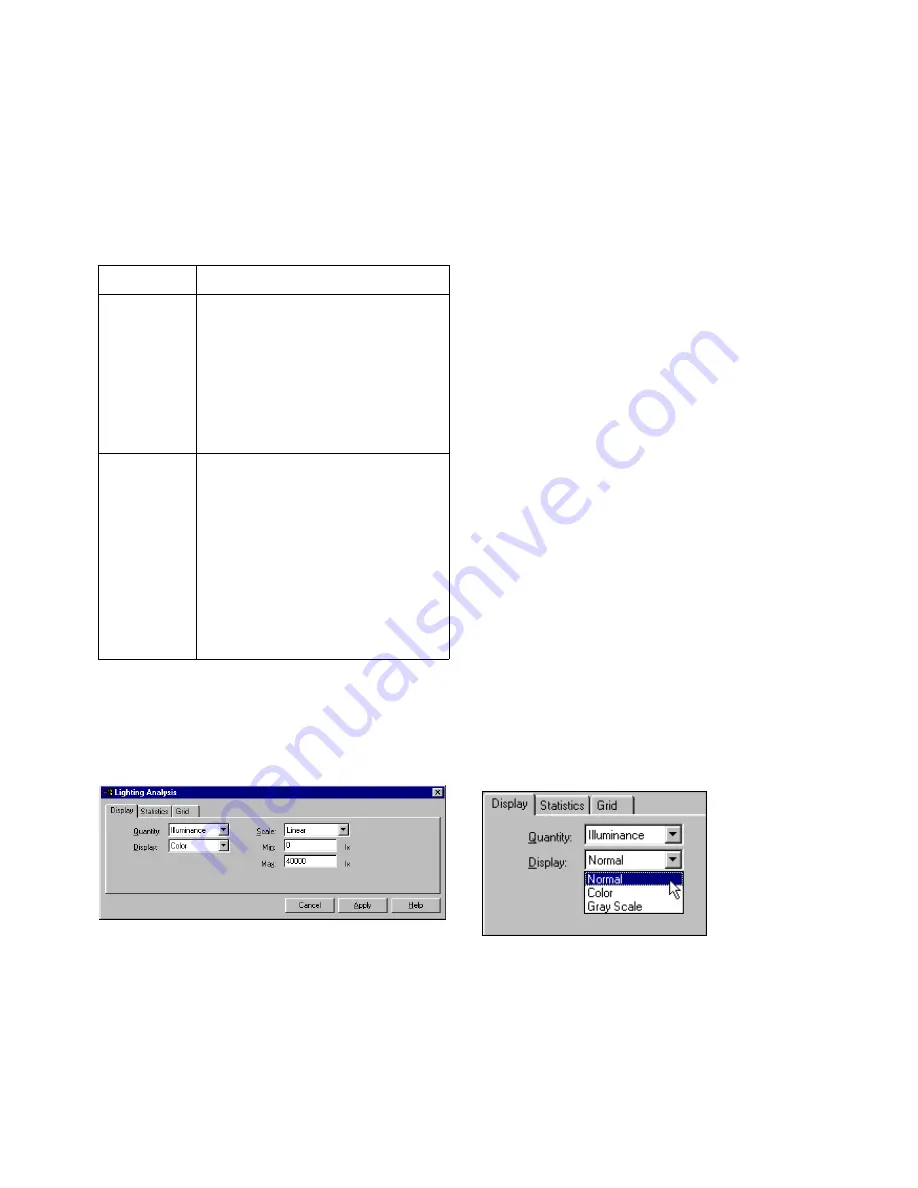
To set illuminance or luminance values:
1.
Choose Light | Analysis.
The Lighting Analysis dialog appears.
2.
Click the Display tab.
3.
From the Quantity list, select Luminance or Illu-
minance.
4.
From the Display list, select Color or Grayscale.
5.
From the Scale list, select Linear or Logarithmic.
Note:
When most values are contained in a small
subset of the target quantity range, the display
shows most of the environment in a single color.
Use minimum and maximum thresholds to narrow
the region of interest and show more
differentiation.
6.
Click Apply.
The model is displayed in pseudo-color. In this
mode, you can adjust the view or zoom to check
lighting values in different areas of your scene. You
can also print pseudo-color displays with their
accompanying scale.
7.
If necessary, adjust the range of light energy val-
ues by entering minimum and maximum range val-
ues in the appropriate boxes. This adjusts the
amount of lighting differentiation. For instance,
there are probably very bright areas in your scene
near the lights that are skewing the range of dis-
played lighting values. Try clamping off some of
these higher light energy values.
To turn off pseudo-color display:
1.
Choose Light | Analysis.
The Lighting Analysis dialog appears.
2.
Click the Display tab.
3.
From the Display list, select Normal.
4.
Click Apply.
Pseudo-color is turned off.
Note:
You can also disable pseudo-color display by
clicking Cancel in the Lighting Analysis dialog.
Use:
To:
Minimum
Set the threshold to a value below
which the system maps values of the
target quantity to the left-most
display color or grayscale level of the
color chart.
By default, Minimum is 0.
Maximum
Set the threshold to a value above
which the system maps values of the
target quantity to the right-most
display color or grayscale level of the
color chart.
By default, Maximum is the
maximum value of the target quan-
tity in the current radiosity solution.
Summary of Contents for LIGHTSCAPE
Page 1: ...SULO 4 31 93 36034333308355 LJKWVFDSH...
Page 18: ...NOTES 10...
Page 110: ...NOTES 102...
Page 136: ...NOTES 128...
Page 166: ...NOTES 158...
Page 176: ...NOTES 168...
Page 202: ...NOTES 194...
Page 210: ...NOTES 202...
Page 248: ...NOTES 240...
Page 294: ...NOTES 286...
Page 308: ...NOTES 300...
Page 316: ...NOTES 308...
Page 324: ...NOTES 316...
Page 342: ...Glossary 334 Lightscape...
Page 360: ...Index ix 352 Lightscape...
Page 362: ......


