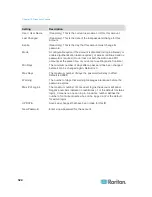
Chapter 16: Diagnostic Console
326
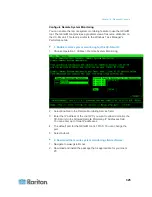
3: Configure the remote system monitoring client to work with
CC-SG:
Follow the instructions in the Read Me file to set the CC-SG unit as the
target to monitor.
Windows users must use the command line to locate the Gkrellm
installation directory and then run the commands specified in the Read.
Display Historical Data Trending Reports
Historical data trending gathers information about CPU utilization,
memory utilization, Java Heap space, and network traffic. This
information is compiled into a report that you view as a web page from
CC-SG. The report contains the status of the CC-SG and links to
historical data.
Historical data trending reports stop collecting data if the CC-SG system
time and date change to an earlier time and date. Data collection starts
again when the time and date reaches the original time and date. When
the time and date is changed to a later time and date, the reports show a
gap in the data.
1: Enable historical data trending display:
1. Choose Operation > Diagnostic Console Config.
2. In the Ports list, select Web.
3. In the Status list, select the Status checkbox next to Web.
4. Click Save.
2: View the historical data trending reports:
1. Using a supported Internet browser, type this URL:
http(s)://<IP_address>/status/
where
<IP_address>
is
the IP address of the CC-SG. Note the forward slash (/) following
/status is mandatory. For example,
https://10.20.3.30/status/
.
2. A status page opens. This page contains the same information as
the Status Console. See
Status Console
(on page 297).
Click the Historical CC-SG Monitors link to view information
about CPU utilization, memory utilization, Java Heap space, and
network traffic. Click each graph to view details in a new page.

