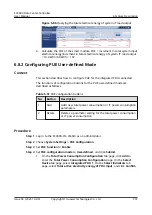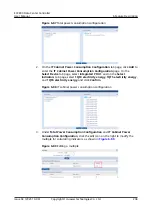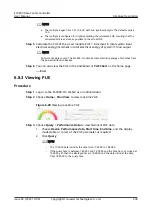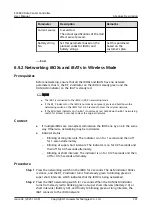
NO TE
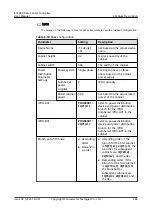
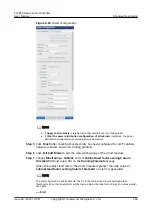
● The multiple ranges from 0.01 to 4.99, with two significant digits. The default value is
1.00.
● The multiple is configured for slightly adjusting the calculated PUE, ensuring that the
calculated PUE is as close as possible to the actual PUE.
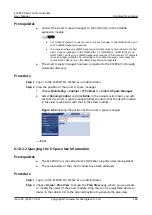
Step 5 Calculate the PUE of the smart module. PUE = Increment in total system input
electrical energy/Increment in total electrical energy of system IT load output
NO TE
Performance data source: The ECC800-Pro obtains total electricity energy of branches from
the power distribution devices.
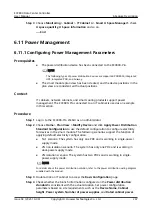
Step 6 You can also view the PUE in the dashboard or PUE Chart on the home page.
----End
6.8.3 Viewing PUE
Procedure
Step 1 Log in to the ECC800-Pro WebUI as an administrator.
Step 2 Choose Home > Plan View to view real-time PUE.
Figure 6-90 Viewing real-time PUE
Step 3 Choose Query > Performance Data to view historical PUE data.
1. Choose Device, Performance data, Start time, End time, and the display
mode (table or curve) of the PUE parameter as required.
2. Click Query.
NO TE
– The 17:00:00 data includes the data from 17:00:00 to 18:00:00.
– If the query time is between 18:00:00 and 19:00:00 and the time has not arrived at
19:00:00 yet, then the displayed time is 18:00:00 and the data includes the data
from 18:00:00 to the query time.
ECC800 Data Center Controller
User Manual
6 Feature Description
Issue 04 (2021-10-09)
Copyright © Huawei Technologies Co., Ltd.
239


