338
Chapter 7 – Color Workflow
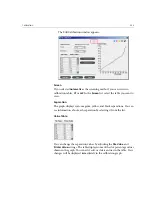
The Density Graph appears. The Density Graph gives you detailed
information about the saved calibration tables.
Calibration graph showing Cyan, Magenta, Yellow and Black separations.
The Density Graph contains the following data:
•
Calibration name
•
Measured D-Max values for each separation
•
Target D-Max values for each separation
•
Minimum accepted density values for each separation (Xerox values)
•
View options: filtering by color - select which colors are shown/hidden
•
Calibration curves (target and measured) for each separation
Target is displayed as bold lines
Measured is displayed as thin lines
•
Index - emphasizes the difference between target lines and measured
lines
Summary of Contents for CXP6000 Color Server
Page 2: ...This page is intentionally left blank...
Page 3: ...Spire CXP6000 color server version 4 0 User Guide...
Page 4: ...This page is intentionally left blank...
Page 8: ...This page is intentionally left blank...
Page 28: ...This page is intentionally left blank...
Page 99: ...Spire Web Center 85 Links The Links page enables you to link to related vendors or products...
Page 169: ...Basic Workflows Importing and Printing Jobs 156 Reprinting Jobs 158 Basic Settings 159...
Page 182: ...168 Chapter 4 Basic Workflows Rotate 180 To rotate your job by 180 select Yes Gallop...
Page 190: ...176 Chapter 4 Basic Workflows Coating Select Coated to print on coated paper...
Page 244: ...This page is intentionally left blank...
Page 326: ...This page is intentionally left blank...
Page 327: ...Color Workflow Calibration 314 Default Color Flow 340 Color Tools 358...
Page 416: ...This page is intentionally left blank...
Page 494: ...This page is intentionally left blank...


