WavePro 7Zi
325
WP700Zi-OM-E-RevA
value determined in this manner is available in the circuit, the threshold signal, along with the optical recognition
data signal itself, should be acquired. Waveform math can then be used to subtract the threshold signal. This is
done by defining a trace as the Arithmetic Difference of the raw data signal and the threshold signal. The new
trace is then used as the optical recognition data signal in the parameter calculations.
Regardless of how the signal is coupled, there are other considerations involved in determining the appropriate
threshold. If waveform math is used, the threshold is always 0 V. Otherwise, the optimum threshold is best
determined using the pmidl parameter.
Some optical recognition standards define the middle level of the 3T signal as the “decision level.” Pmidl
configured for the single 3T pits/spaces is an ideal candidate for the best threshold value. Another candidate is
the pmidl value calculated using the entire range of n indices possible. In this way, pmidl calculates the best
overall threshold level as a weighted average of middle levels calculated for each n index.
In AORM, the ODATA function can be used to remove these effects. Its “leveled” output subtracts the “threshold”
(low frequency content of the signal) from the input data.
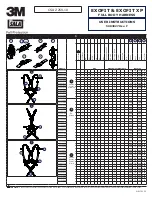
Using Parameters with Trends and XY Plots
X-
axis
Y-
axis
t@pit
Dp2c
edgsh
pbase
pmax
pmin
ptop
pwid
pwid
pbase
pmax
pmin
ptop
ptop pmax
pbase pmin
We saw in the
t@pit
parameter description how the ORM parameters have certain
unique characteristics that make particular measurements useful when trended together
with XY plots. And how the t@pit parameter is essential to those measurements. Plots
that can be generated on single acquisitions include those listed in the table at left.
The reason that these plots are considered useful on single acquisitions is because the
parameters are guaranteed to be configurable in a manner that meets the following
criteria:
x
Each parameter is capable of providing multiple values per acquisition.
x
Each parameter pair is configurable in a manner that guarantees the same
number of events per waveform.
x
Each parameter pair must be configurable in a manner that guarantees a one-to-
one correspondence between parameter calculation values.
Example and Step-by-Step Instructions
Here is an example typifying the use of XY plots without the t@pit parameter. A complete example using t@pit
has been provided in the section dedicated to this parameter description.
Consider a situation in which it is desirable to find the relationship of the pit top value to the pit width in an optical
recognition data waveform:
The scope is set up to acquire this waveform by assigning Channel 1 to the data signal at a time/div of 0.2 ms.
This signal will contain approximately 1800 pits/spaces. The ideal threshold has been determined by the pmidl
parameter as 1.9 mV.
The
ptop
custom parameter is assigned to
P1
, and the
pwid
parameter is assigned to
P2
. Use configuration
tracking to configure both parameters in the following manner:
hysteresis = 0.5 divisions
threshold = 1.9 mV
polarity = Pos
range of n
low
n
= 3
high
n
= 11
period = 231.5 ns
Содержание DDA 7 Zi series
Страница 1: ...Operator s Manual WavePro SDA and DDA 7 Zi Series Oscilloscopes ...
Страница 2: ... L R R H HUD RU D D ...
Страница 41: ...Operator s Manual WP700Zi OM E RevA 40 The detachable WavePro Zi front panel ...
Страница 376: ...WavePro 7Zi 375 WP700Zi OM E RevA Absolute Offset Relative ...
Страница 439: ...Operator s Manual WP700Zi OM E RevA 438 ...
Страница 440: ...WavePro 7Zi 439 WP700Zi OM E RevA ...
Страница 544: ...Thank you for purchasing a WavePro SDA or DDA 7 Zi Oscilloscope ...