232
Waveform Calculation Settings
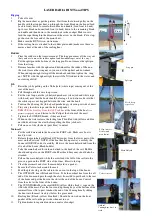
11.2.3 Change the Display Method for Calculated Waveforms
Procedure
Press the
STATUS
key to open the Status screen, and then select the
[Wave Calc]
sheet.
3
Upper and
lower limits
To copy settings between
Calculation Nos.:
Select
F1 [Copy]
.
Calculation No.
Waveform color
1
2
Display range
setting method
4
Displayed measurement
units
5
Graph to display
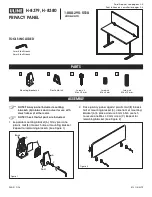
1
Enable waveform display and
display color
Move the cursor to the
[Wave]
column.
On-Off
Set On to display the waveform of the
calculation No. for the currently selected row
(Default setting). Set to Off to not display this
waveform.
↑↓
Select the waveform color.
All On-Off
Select On to display all waveforms. Select
Off to hide all waveforms.
2
Select a method to set scaling
Move the cursor to the
[Scale]
column for the Calculation
No. you want to adjust.
Auto
Automatically sets the display range of the vertical
axis. (After calculation, the upper and lower limits are
obtained from the results, and set automatically.)
Manual
Upper and lower limits of the vertical axis display
range are entered manually.
Depending on calculation results,
automatic scaling settings may be
unsatisfactory,
in which case the limits must be
entered manually.
3
Set the upper and lower limits of the display range
(When
[Manual]
is selected)
Select
[Lower]
and
[Upper]
.
Select an entry method and enter the limit values.
Entry range: −9.9999E+29 to +9.9999E+29
Refer to “8.1.3 Alphanumeric Input” (p. 143).
4
Specify the physical units.
Move the cursor to the
[Unit]
column.
Select an entry method and enter the physical units.
Refer to “8.1.3 Alphanumeric Input” (p. 143).
5
Select the graph to be displayed.
(When the split screen [Format] item on the [Status] sheet
is
[Dual]
or higher)
Move the cursor to the
[Graph]
column and select the
graph number.
Summary of Contents for MR8827
Page 19: ...14 Operation Precautions ...
Page 81: ...76 Start and Stop Measurement ...
Page 111: ...106 Manage Files ...
Page 125: ...120 Miscellaneous Printing Functions ...
Page 143: ...138 View Block Waveforms ...
Page 191: ...186 Setting Output Waveform Parameters ...
Page 291: ...286 FFT Analysis Modes Measurable Ranges With Octave Analysis 1 1 OCT 1 3 OCT ...
Page 292: ...287 FFT Analysis Modes 1 1 OCT 1 3 OCT 13 FFT Function ...
Page 293: ...288 FFT Analysis Modes 1 1 OCT 1 3 OCT ...
Page 295: ...290 FFT Analysis Modes ...
Page 309: ...304 Editor Command Details ...
Page 387: ...382 Module Specifications ...
Page 405: ...400 Dispose of the Instrument Lithium Battery Removal ...
Page 431: ...A26 FFT Definitions ...
Page 436: ......