6.7 ANALYSE MENU (IMAGE PROCESSING FUNCTION)
6.7.1 Profile
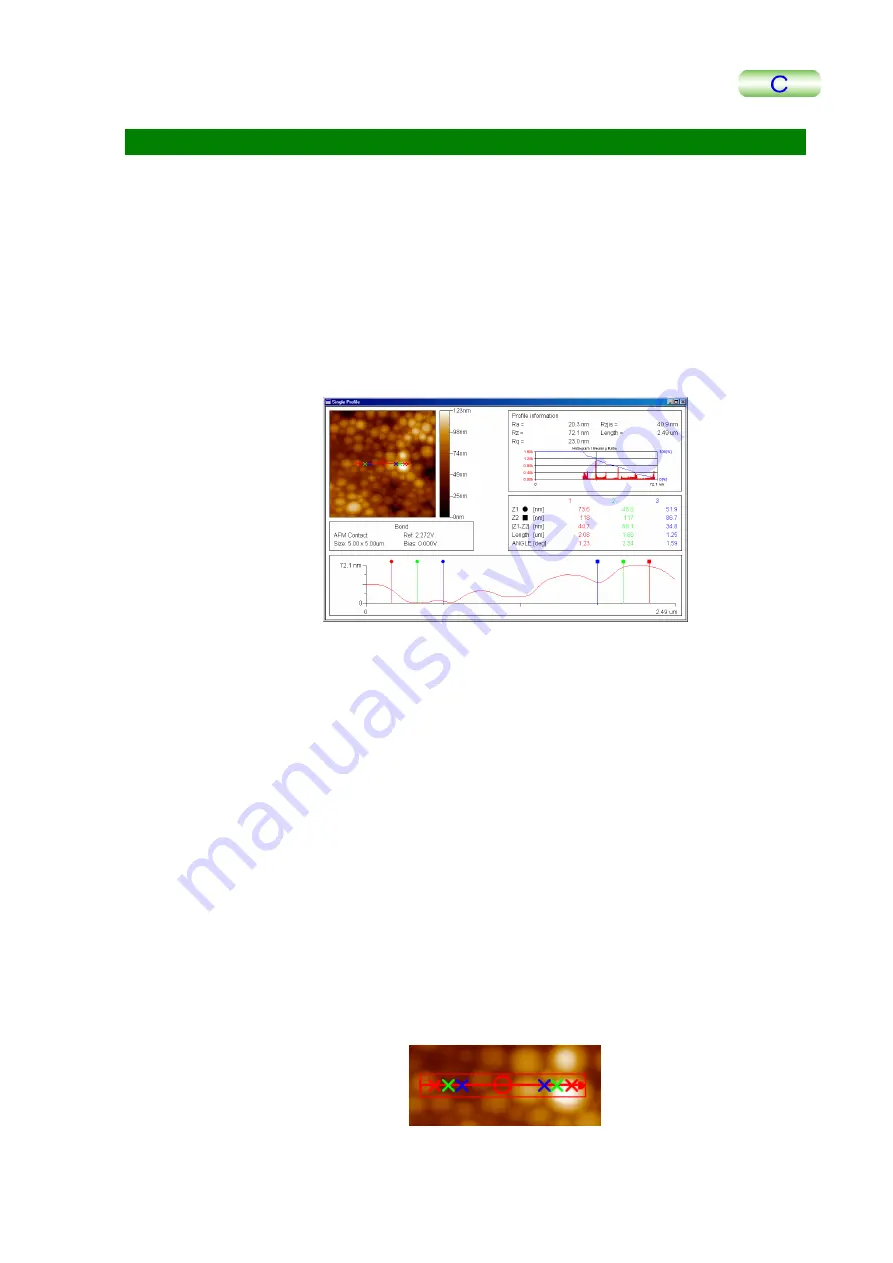
In the current image, a straight line is drawn between two specified points, and the height
data along this straight line is line-plotted and displayed.
The results of analysis are displayed in a dedicated window that is separate from the
Display Window.
■
Single Profile
This function analyzes and measures the line profile in the analysis image.
Select Profile – Single from the Analyse menu.
Designating Analysis Position
•
Preview image
The preview of the analysis image is displayed together with height data. Designate
the analysis position by moving the line indicated by the arrow.
•
Designating the analysis position
If you align the mouse cursor with both ends of the line, the cursor will change to a
cross-cursor. You can then change the analysis position by dragging the cursor with
the button on the mouse held down.
You can also change the cursor to a cross also by aligning the mouse cursor to the
center of the line. The entire line can be moved by dragging the cursor with the left
button on the mouse held down in this state.
While the cursor is changing to a cross, the coordinate on the image is displayed in
the pop-up window.
•
Broad line and simple line
You can change the cursor to a cross by aligning the mouse cursor to both ends of
the line. The submenu can be displayed by clicking the right button on the mouse in
this state.
Selecting Broad line changes the display of the line as shown below.
TMPM5200-2
6-35


