5-60
TMPM5200-2
8.
D
k
z is in the vicinity of the
sonance point when you begin the frequency sweep, the effect of the resonance
me value as Start
the resonance point might not be measured correctly.
9.
he OSC On check box.
10.
C
the
butt
lick on the Cancel
ks like the figure shown below.
7.
Double-click on the Output Amp/V input box; then enter 0.2 using the
keyboard.
ouble-click on the Frequency/KHz input box; then enter 250 using the
eyboard.
The reason why you enter 250 is that, if this Frequency/KH
re
might still remain even though the frequency is set to the sa
Frequency/KHz, meaning that
Set Frequency/KHz to the same value as Start Frequency/KHz.
Click on t
The box changes to and the cantilever starts vibrating.
lick on the Scan button in the Tuning frame.
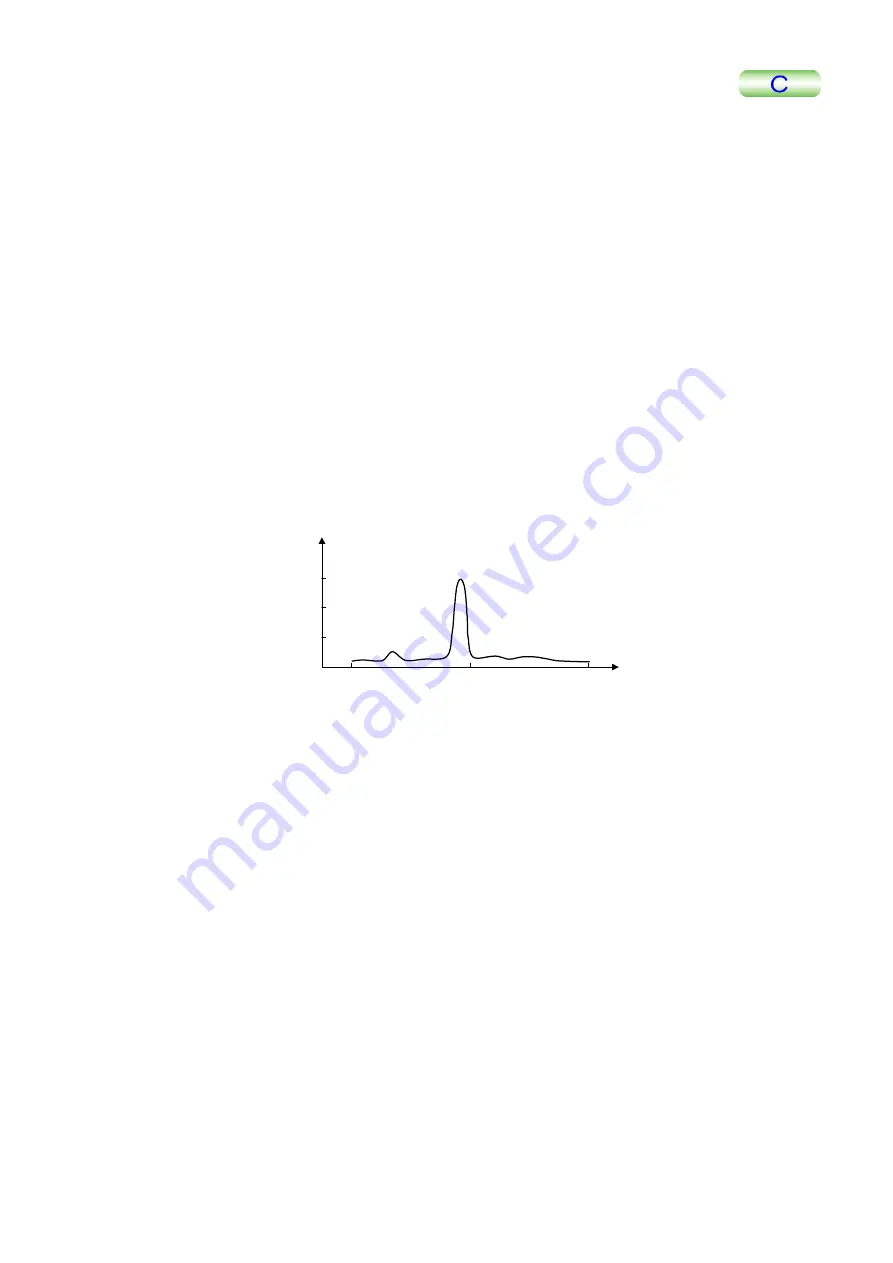
The frequency sweep takes place and the frequency sweep data is displayed in
Display Window. Since the Enter image title window will appear, click on the OK
on if you want to save the data. However, you usually c
button.
The frequency sweep data roughly loo
V
250
6
300
f
350
The peak frequency is indicated as Peak Frequency/KHz in the Cantilever Tuning
window. If no correct data is obtained, confirm that the following points are set.
•
STM/AFM in the Scan frame in the Advanced tab window is set to AC.
•
High Pass Filter/KHz and Low Pass Filter/KHz in the Cantilever Tuning window
are set to the correct values.
•
OSC On is checked (“ ”).
•
SUM for the AFM AMP unit is set to within a range of –1.0 to –9.0 V, and AFM
and FFM are both set to somewhere near 0 V.
•
When the Force waveform is observed while increasing the CH2 gain of the
optional oscilloscope, the waveform is a sine curve.
To sweep the frequency in a narrower frequency range
Perform frequency sweep in the frequency range of
±
10 kHz of the obtained
Peak Frequency/KHz value.
For example, if the obtained Peak Frequency/kHz value is 290 kHz, perform the
frequency sweep again by setting Start Frequency and Stop Frequency to 280 kHz
and 300 kHz, respectively.
4
2


