background image

5 - 1 

5  MAINTENANCE 

 
Continuous use of the instrument without periodic inspection and 
maintenance may result in degradation of components that can 
cause some serious problems, including gas leakage, liquid leakage, 
electricity leakage, or ignition. 
Perform inspection and maintenance according to the specified 
intervals regardless of the frequency of use. 


5.1  Replacement of Pump Tube 

 
When a pump tube is deteriorated or damaged (torn), replace with a 
spare. The procedure is instructed below. 
 
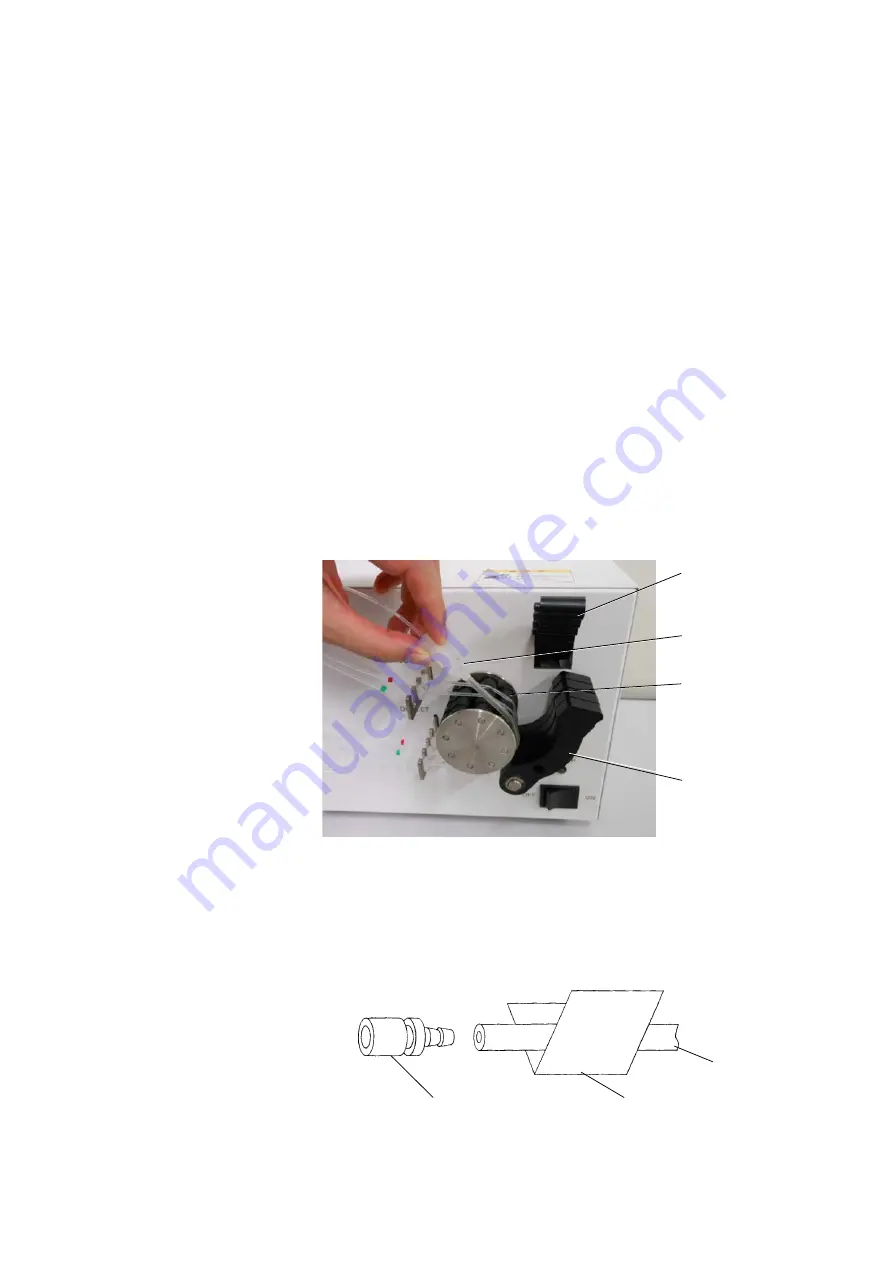
(1)  Release the support clamp lever by raising it. 
 
(2)  Turn the tube support down. 
 
(3)  Disconnect the pump tube from the rotor. 


Fig. 5-1    Removal of Pump Tube 

 
(4)  Disconnect the old tube from the nipple. 
 
(5)  Connect a new tube to the nipple using the furnished sandpaper. 


Fig. 5-2    Connection of Pump Tube and Nipple 


Sandpaper 

Pump tube 

Nipple 

Support clamp 
lever 


Nipple 


Pump tube 


Tube support 

Summary of Contents for ZA3000 Series

Page 1: ...ETER OPERATION MANUAL FLAME ANALYSIS Hitachi High Technologies Corporation 24 14 Nishi Shimbashi 1 chome Minato ku Tokyo Japan 2nd Edition December 2012 Copyright C Hitachi High Technologies Corporation 2012 1st Edition 2012 All rights reserved Printed in Japan Part No 7J1 9007 1 HF TF HK HMS ...

Page 2: ...arty in any form or by any means without the express written permission of Hitachi High Technologies Corporation 3 Hitachi High Technologies Corporation assumes no liability for any direct indirect or consequential damages arising from use not described in this manual Utmost care must be exercised when using the instrument 4 This document does not provide any warranty or permission for industrial ...

Page 3: ...NUAL This instruction manual consists of the three manuals below Maintenance manual for Hitachi ZA3000 series Polarized Zeeman Atomic Absorption Spectrophotometer Instruction manual for Hitachi ZA3000 series Polarized Zeeman Atomic Absorption Spectrophotometer Flame Analysis edition Instruction manual for Hitachi ZA3000 series Polarized Zeeman Atomic Absorption Spectrophotometer Graphite Furnace A...

Page 4: ...ally For evading possible injury or death every safety message that follows this symbol shall be obeyed DANGER Indicates an imminently hazardous situation which if not avoided will result in death or serious injury WARNING Indicates a potentially hazardous situation which if not avoided can result in death or serious injury CAUTION Indicates a potentially hazardous situation which if not avoided m...

Page 5: ...inal usage of the product and the usage specified in this manual Never attempt modification of the instrument use of a part other than specified and instrument operation with safety devices released because they are dangerous Do not perform operations other than those described in the instruction manual If any problem occurs on the instrument contact our sales representative or service office In a...

Page 6: ... be unobtainable but also personal injury may be caused Precautions on Use In analysis with the atomic absorption spectrophotometer flame ignition or atomizer furnace heating is performed A fire or explosion may be caused if operation is carried on in an abnormal condition such as abnormal sound abnormal odor smoke or gas leak Be sure to carry out analysis in the presence of the analyst Avoid unat...

Page 7: ...nt instructions carefully Never attempt maintenance not described in the manual Failure to do so could cause malfunction of the instrument or personal injury Avoid moving the instrument after installation This might result in deviation of the precisely adjusted optical system may get out of order due to vibration etc If a warning label is deteriorated due to secular change or damaged contact our s...

Page 8: ...it are listed below List of DANGER Indications Malfunction of Pacemaker There is a danger of faulty operation of a pacemaker due to the strong magnetic field produced A person who uses a pacemaker should not come within 1 meter of the instrument or should avoid handling the instrument altogether Sections 3 and 5 in this manual ...

Page 9: ... sure to operate the ventilating fan to discharge the vapor emitted from the sample through the exhaust duct Sections 1 3 and 5 in this manual Explosion due to Backfiring If water is not supplied to the drain trap there is a danger of explosion due to backfiring or ignition due to gas leakage Be sure to supply the drain trap with water Sections 1 and 5 in this manual Explosion due to Acetylide For...

Page 10: ...y that form metal acetylide and perchloric acid are contained in a sample when using a high temperature burner they react in the flame chamber and may result into explosions with loud noise due to backfiring Do not measure samples containing metals that form metal acetylide and perchloric acid when using a high temperature burner ...

Page 11: ...ctive goggles when using the instrument And do not detach the window at the front of the flame section when using the instrument Section 3 in this manual Do Not Touch Hot Parts There is a danger of burns upon touching heated parts Especially the burner remains hot for a while even after extinguishing the flame When exchanging the burner turn off the flame wait for more than 10 minutes make sure th...

Page 12: ...acid other than hydrochloric acid or hydrofluoric acid may damage the burner chamber Particularly avoid using concentrated nitric acid concentrated sulfuric acid or aqua regia since they will corrode the chamber Section 3 in this manual Strong Magnetic Fields The atomizer unit utilizes a magnet The strong magnetic field produced may cause damage to a watch magnetic card and so on Avoid bringing su...

Page 13: ...AFETY 8 Strong Magnetic Fields SAFETY 8 Beware of Intense Light SAFETY 8 Do Not Touch Hot Parts SAFETY 8 List of CAUTION Indications SAFETY 9 Malfunction by Wrong Gas Type SAFETY 9 Deterioration of Burner Chamber by Chemicals SAFETY 9 Strong Magnetic Fields SAFETY 9 1 START UP 1 1 1 1 Check of Instrument 1 1 1 2 Mounting of Hollow Cathode Lamps 1 2 1 3 Supply of Gases 1 4 1 4 Power on 1 5 1 5 Powe...

Page 14: ... 1 8 Setting QC Conditions 3 22 3 1 9 Setting Report Format 3 23 3 1 10 Check of Analytical Conditions 3 23 3 2 Verification of Measurement Condition 3 25 3 3 Monitoring of Measurement Process 3 26 3 4 Wavelength Adjustment 3 30 3 5 Check of Optical Axis of Atomizer 3 32 3 6 Supply of Cooling Water 3 32 3 7 Ignition of Flame 3 33 3 8 Start of Measurement 3 36 3 8 1 Preparation for Measurement 3 37...

Page 15: ...n Correction Factor 4 23 4 5 5 Changing Sample Name 4 23 4 5 6 Changing Sample Unit 4 24 4 5 7 Changing Digits Below Decimal Point 4 24 4 5 8 Editing Reagent Name 4 24 4 5 9 Restoring the Recalculated Results 4 24 4 5 10 Detailed Display of Profile Graph 4 24 4 5 11 Specifying a Sample Blank 4 24 4 6 Use of the Data in Other Applications 4 26 4 6 1 Output in Text Format or Excel Format 4 26 4 6 2 ...

Page 16: ... Curve Range and RSD Check Sample 6 5 6 2 1 Setting Procedure 6 5 6 2 2 Contents to be printed on the report 6 6 6 3 Using the QC Sample Check QC Sample 6 7 6 3 1 Setting Procedure 6 7 6 3 2 Contents to be printed on the report 6 9 6 4 Displaying QC Message 6 10 7 TERMINATING OR CONTINUING MEASUREMENT 7 1 7 1 Changing the Analyte Element for Continuous Measurement 7 1 7 2 Terminating Measurement 7...

Page 17: ... v 8 3 5 Checking and Saving the Diagnostic Results 8 9 8 3 6 Output of Diagnostic Results 8 11 9 TROUBLESHOOTING 9 1 INDEX INDEX 1 ...

Page 18: ...or the ZA3000 3 Is the burner slot dirties or clogged 4 Is the drain receptacle such as waste solution bottle filled 5 Is there a sufficient amount of the gases If the primary pressure of the acetylene gas drops to 0 5 MPa or lower the solvent inside may flow out and damage the piping or spectrophotometer In such a case replace the gas cylinder with a new one 6 Is there enough paper in the printer...

Page 19: ...this instrument Never connect hydrogen gas to this instrument 1 2 Mounting of Hollow Cathode Lamps Mount the hollow cathode lamps to be used for measurements Opening the cover of the lamp compartment exposes the lamp turret Fig 1 1 Make sure of no dirt on the top surface of the hollow cathode lamp If any dirt is attached wipe it off with paper or the like that does not leave fibers behind Such dir...

Page 20: ...holder number For the lamp vertical positioning raise it to the position where the metal part of the lamp seal part closer to the lamp electrode contacts the lamp holder plate lower Each unused socket for should be fitted to the lamp turret by pinching it with the lamp holder plate on the upper level and the plate spring NOTES 1 An unused lamp socket should be secured by fitting it to the receptac...

Page 21: ... open the main valve of each gas cylinder NOTE Solvent such as acetone is included in the acetylene cylinder To prevent deterioration of gas piping or damage to the instrument due to the outflow of solvent replace the cylinder with a new one when gas pressure primary pressure degreases to 0 5 MPa Firmly fasten the main cock of each cylinder after use 3 Set the secondary pressure supply pressure of...

Page 22: ...r switch Fig 1 2 on the front right of the atomic absorption spectrophotometer Then start up the PC Fig 1 2 Power Switch NOTE When the spectrophotometer power is turned ON the spectrophotometer will be initialized about 15 seconds To enable communication with the PC start up the PC or the spectrophotometer software after the initialization is completed Power switch ...

Page 23: ...sion WARNING Beware of Toxic Gas Inhalation of toxic gas could be injurious to human health Inhaling the vapor emitted from the sample may cause inflammation of the respiratory tract Be sure to operate the ventilating fan to discharge the vapor emitted from the sample through the exhaust duct 1 6 Basic Operation Flow Figure 1 3 shows the basic operation flow of the atomic absorption spectrophotome...

Page 24: ...d cooling water Execution of auto zero Measurement of standard sample End of measurement Saving editing printing of measurement result Stop of cooling water Power off of spectrophotometer main unit and PC Termination of AAS program Removal of hollow cathode lamps and stop of gas supply and duct Allowable range of automatic start Check of working curve Turning on flame Aspiration of purified water ...

Page 25: ...er to the spectrophotometer main unit wait at least 15 seconds and then double click the shortcut icon Zeeman AAS Fig 2 1 on the PC screen Fig 2 1 Shortcut Icon of Zeeman AAS 2 The initialization window appears and the atomic absorption spectrophotometer program is started Fig 2 2 Initialization Window ...

Page 26: ...t must be set to online mode for conducting measurement There are two methods for selecting online status at startup of the instrument Refer to section 5 10 Setting Automatic Start for details Described next are two procedures at startup of the instrument The Method window in Fig 2 3 appears and online processing starts automatically process in which communication with the spectrophotometer main u...

Page 27: ...day Fig 2 5 Dialog box for confirmation of water leak from the flow path Since you cannot make it online unless the initialization is completed about 15 seconds after the instrument is turned on if Communicate with Instrument at Startup is not selected turn on the instrument to complete instrument initialization before the start up of the software application If Communicate with Instrument at Star...

Page 28: ...online status click On line in the Tools menu in the menu bar see Fig 2 6 The progress of the initialization can be checked via the status of the time bar shown during the online mode Fig 2 4 Then check for water leak see Fig 2 5 Fig 2 6 Execution of Online Processing 2 2 2 When Communicate with Instrument at Startup is Not Selected ...

Page 29: ...At the same position click the left mouse button twice in a row The atomic absorption spectrophotometer software includes four fundamental windows Monitor Method Data Process and Diagnosis windows The left bottom button can switch over windows The names and functions of the window elements will be explained taking the Method window Fig 2 7 as an example Displayed around the edges of the window are...

Page 30: ... in the underlined letter of the menu item name Example Key in Alt F when selecting File F Upon selecting the menu item the commands included in it are displayed as in Fig 2 8 Fig 2 8 Example of Menu 2 Toolbar Located just under the menu bar It contains a number of small buttons arranged horizontally These buttons are used for executing commands or functions of the atomic absorption spectrophotome...

Page 31: ...layed with respect to mouse pointer or cursor position Allowable input range for item Description of toolbar or toolbox buttons Description of command For setting the instrument conditions for atomic absorption spectrophotometer click the necessary button to open a window and then display data or enter numerical values A number of input methods are available as described below 1 Selection among Ra...

Page 32: ...the display as shown in Fig 2 11 clicking the down arrow presents a list of input values Move the cursor to the desired value or item and click to select it Fig 2 11 Example of Numeric Value Selection 4 Input of Numeric Value In the display as shown in Fig 2 12 double clicking the numeric area allows direct input of a numeric value The settable range of numeric value will be displayed on the statu...

Page 33: ...as shown in Fig 2 13 you can input a character string directly after clicking inside text box Move the mouse pointer onto the input column and the maximum number of characters will be displayed in a tooltip frame Fig 2 13 Example of Character String Entry ...

Page 34: ...ecify a folder in which the target file is contained in Look in Default method file Library Document ZeemanAAS Method Default data file Library Document ZeemanAAS Data If a different location is stored after file opening or saving at any location other than default A change may be required Fig 2 14 Open Method Dialog Box When clicking the down arrow at the right of Look in you can see the hierarch...

Page 35: ...e click the Open button or double click the file in the list For saving a method or data file implement the following procedure 1 Click Save As in the File menu using the Method or Data window and the file saving dialog box will open as shown in Fig 2 15 For saving the data for the first time after measurement the same dialog box can be displayed by clicking the Save button 2 In Save in specify th...

Page 36: ...yy_mmdd_hhmm_ss adf yyyy mm dd hh mm ss denotes the date and time point of measurement end The default names may be used as they are Fig 2 15 Save Method As Dialog Box When correcting an already saved file and re saving it with the same name click Save Method or Save Analysis Results in the File menu ...

Page 37: ...explanation 1 Calling Help for Window Click the Help button in the tool bar in the Method window to display the help for the presently open window Clicking a description with a green underscore displays the help for that description Fig 2 16 Fig 2 16 Help for Elements Window 2 3 6 Asking for Help ...

Page 38: ...ethod window Fig 2 17 Save Analysis Results as Dialog Box Fig 2 18 Help Window 2 Checking with Contents Open the Help menu and select the Index command in the menu bar The dialog box for the contents of Help for the atomic absorption spectrophotometer will be displayed Fig 2 19 When you click a description with a green underscore among the help items new help items appear ...

Page 39: ... Input the characters to be searched in the keyword input box on the Help window and the searched keywords will be displayed Select the objective item and click the Display button The relevant help will be displayed Fig 2 19 Help Window ...

Page 40: ...ns used at auto start When changing the measurement conditions read out from the existing file Reference 2 3 4 Opening Files For creating measurement conditions open the Method window Fig 3 1 then open the windows in succession by clicking the buttons on the toolbar from left to right and enter your settings For changing over the windows for entry either click the respective buttons or use the Pre...

Page 41: ...he measurement mode will be the latest ones set previously for that mode 2 Click the button 12 in Fig 3 1 at the right end of the Sample Introduction item and then select Manual from the list that appears 3 For Operator Analysis Name and Comment desired characters can be input after clicking each input box However analysis can be carried out with no inputs in these fields Also Operator Analysis Na...

Page 42: ...ellow green to change the color to white To uncheck Measurement in the Element Order click the check mark in the Measurement column The row will remain in the table but measurement will not be carried out Click Delete Click No in the Element Order column for the element to delete to change the color of the row of the element to blue 3 in Fig 3 2 Click the Delete button Click the Delete All button ...

Page 43: ...ndow The following 3 Set the following items Signal Mode BKG Correct is normally used and need not be changed BKG Correct Measurement is made using background correction signal obtained by subtracting reference signal from sample signal via the polarized Zeeman method Sample Measurement is made using absorption signal corresponding to sample beam in double beam optics that has not been corrected R...

Page 44: ...cified height in versus the maximum absorbance of STD2 is calculated In the subsequent measurements the slicing height absorbance to which this time width is applied is determined and quantitative measurement is made based on this absorbance The input range of slicing height is from 1 to 50 Wavelength Normally the wavelength ensuring the highest sensitivity for the set element is selected as a def...

Page 45: ...ng Normally set at Automatic and need not be changed Automatic A peak of lamp energy near the measuring wavelength is searched for and set automatically Direct Wavelength is driven directly to the set wavelength This mode is dependent on the accuracy of the wavelength drive mechanism and will not necessarily move to the peak position of lamp energy Slit Width Specify a slit width for the monochrom...

Page 46: ...ete it from the check box the lamp current is turned OFF used in flame photometry mode PMT Voltage Specifies a voltage at which to start the search for an optimum photomultiplier voltage in the automatic setting of lamp energy Normally the optimum value is preset for the set element and need not be changed Since the optimum voltage will be searched for automatically even if the PMT voltage setting...

Page 47: ...ture burner for elements whose atomizer temperature is greater than that The high temperature burner and Hg cell are options For using these items refer to their respective instruction manuals To change the default setting for a particular application examine the optimum conditions with respect to type of flame and or gas flow rate Flame Type Normally a type of flame corresponding to the atomizer ...

Page 48: ...ue calculated according to the pressure of each gas Burner Height Since the burner height is not set automatically it must be adjusted with the burner height adjusting knob on the flame atomizer section The value entered on the window is one to be recorded as a measurement condition Normally the optimum value is indicated as a default setting so the knob should be adjusted in accordance with this ...

Page 49: ... work for samples such as a blank solution of which absorbance is almost no different from the baseline In that case manually click Start Continuous Measurement When this check box is turned on measurement of samples will be performed through continuous injection of sample and data will be acquired continuously according to the number of repetitions without rinsing with pure water in between measu...

Page 50: ...3 1 6 3 11 1 Click the Standards Table button 5 in Fig 3 1 to open the Standards Table window Fig 3 6 Fig 3 6 Standards Table Window 3 1 6 Setting Standards Table 1 ...

Page 51: ...omization of the element Multiple samples containing similar coexisting materials are quantified with one working curve Specify Working Curve here For the details of Absorbance STD Add and Simple STD Add refer to 5 1 Various Measurement Methods Order Specify the order of working curve Linear or Quadratic is normally selected In flame analysis the working curve generally tends to bend at an absorba...

Page 52: ...f the measurement can be checked by making multiple measurements of the same sample Input range is from 1 to 20 STD Decimal Place Specify the number of digits under decimal point Input is effective within a range from 0 to 4 Input can be changed after measurement Refer to 4 5 7 Changing Digits below Decimal Point STD Unit Enter the concentration unit for the standard solution Measurement can be ma...

Page 53: ...xisting or saved working curve The sensitivity changes with the state of the instrument Use the latest possible working curve The accuracy of analysis values is lower than that of normal measurements Usually saved working curve is not used and a new working curve is created for measurement of an unknown sample This item is shown grayed out when there is no saved working curve UNK Replicate Specify...

Page 54: ...ample Table window Fig 3 7 If Sample Name Conc Correct display is not contained in this window the Sample Name Conc Correct tab 1 in Fig 3 7 must be clicked for the display Fig 3 7 Sample Table Window 2 Setting of Number of Samples Enter a number of unknown samples in the No of UNK column and click the Reset button or Change button To add or delete unknown samples use the Insert UNK button or Dele...

Page 55: ...r of the entered sample table The method of changing the sample table varies according to the relationship between the number of samples in sample table and the entered No of UNK a When the entered No of UNK is greater than the number of samples in sample table Example of execution Click Change button with 5 set for number of samples in sample table and 10 set for No of UNK Fig 3 8 Change of Sampl...

Page 56: ...g 3 10 Change of Sample Table c 1 The number of entered No of UNK from the head No 1 of the sample table is left and the UNK sample after that is deleted Fig 3 11 Change of Sample Table c 2 Insert UNK button Click the No of the sample next to the sample to be inserted so that the entire row of the number turns blue Then click the Insert UNK button The ID of the inserted samples is set to ID 1 of t...

Page 57: ...d sample becomes 4 Fig 3 13 Insert of UNK Sample 2 NOTE The ID of the inserted UNK sample must change so as not to overlap with the ID of the existing UNK sample Delete UNK button Click the No of the target sample so that the entire row of the number turns blue Then click the Delete UNK button Fig 3 14 Delete of UNK Sample 1 Then the selected row is deleted ...

Page 58: ...lick the No part of the object sample with the mouse while holding down the Shift or Ctrl key and this row will turn blue then click the Set button To add successive numbers after the sample name click the Auto Numbering check box and enter the first one of the successive numbers at Start No select the object sample row and click Set button There are two ways of selecting a sample row a Click the ...

Page 59: ...with automatic numbering 5 For setting the standard sample name click the STD Sample Name button to open the entry window and enter sample names the same as with unknown samples The BLANK indicated here is a blank solution for use as a reference when using the standard addition method and is unrelated to the working curve method Measurement can be made without inputting sample names Fig 3 18 STD S...

Page 60: ...centration W Weight L Solvent volume D Dilution factor F Correction factor When the same numerical values will be entered for each sample select the row to be copied click the Copy Conc Correct button then select the row of the copy destination and click the Paste Conc Correct button The unit may change with the value entered If this is the case check the UNK Sample Unit Example A solution with 1 ...

Page 61: ... UNK button To deselect a measurement object similarly click the relevant row and when it turns blue click the row again or click the Not Measure UNK button A QC button 8 in Fig 3 1 is provided on the Method window and checks on RSD working curve and other items can be made But quantitative measurements can be carried out even if these functions are not utilized Described here as a simple measurem...

Page 62: ... being overwrtitten Automatic reporting If this box is checked the measurement results will be printed in the specified format after completion of the measurement sequence Formats include print paper text and Microsoft Excel When auto printing is not specified printing can be made upon selecting the desired items at the end of measurement Given here is a simple example where auto printing is not m...

Page 63: ...3 1 Generation of Measurement Conditions 3 24 Fig 3 20 Parameter List Window for each element Fig 3 21 Parameter List Window Conditions common to all elements The setting of method is thus completed ...

Page 64: ...lick Yes if you will save the conditions Refer to 2 3 5 Saving Files Saving of a file can also be executed by clicking Save Method File or Save as under the File menu Note that even if the save process is not conducted for the analytical conditions they will be saved along with the corresponding results when saving the latter and thus can be used for the next measurement Click No if you will not s...

Page 65: ...on of the mouse on a graph a menu will be displayed to allow scale change and other manipulations Fig 3 23 Configuration of Monitor Window 1 Monitor Graph Absorbance signal can be monitored in real time Normally the background correction signal is indicated in red and the background absorption reference signal in blue Absorbance data of the latest measured sample is indicated at the top of the win...

Page 66: ...ble of Each Element the value mean value for each sample ID is indicated Under selection of Detail Table the repetitive measurement data for the specified sample ID is indicated In the latter case the sample ID needs to be specified after clicking the down arrow at the right of Sample ID To specify the sample ID to check click the down arrow on the right side of the sample ID Also the element for ...

Page 67: ...lied to the photomultiplier is read here A lower photomultiplier voltage indicates a higher light intensity so this voltage is useful as a reference for judging a change in lamp energy or a wavelength deviation If the PMT voltage increases check the line spectrum of the hollow cathode lamp Click Display Line Spectrum in the Check Instrument menu If the line of the line spectrum is waving change th...

Page 68: ...ensor A red indication is provided when the water volume is low or the switch of the drain lid is not fully inserted These indicate the status and present flow rate of fuel gas and oxidant gas A red indication appears when gas pressure is insufficient ...

Page 69: ...Set Conditions dialog box Fig 3 24 Set Conditions Dialog Box 2 Check that the element to be measured first has been selected indicated in blue then click OK button Check that the Lamp No matches the number of the socket of the hollow cathode lamp Check that the lamp surface is free of dust and dirt 3 In the status column of instrument monitor bar Set Conditions is now displayed and the specified l...

Page 70: ...pears at the center of the displayed spectral graph and then click the OK button Fig 3 25 Lamp Spectrum Dialog Box CAUTION Beware of Intense Light The hollow cathode lamp emits intense ultraviolet rays Directly gazing at the lamp could therefore result in impaired vision Do not look directly at the light from the hollow cathode lamp ...

Page 71: ...ure immediately after the flame is off Make sure the temperature is sufficiently lowered before touching the burner head 3 6 Supply of Cooling Water Supply cooling water to the instrument NOTES 1 A water flow of about 0 8 L min or higher and within a pressure range of 35 to 50 kPa about 0 35 to 0 5 kgf cm 2 is required Note that if the cooling water temperature is much lower than the room temperat...

Page 72: ...ds 3 As the sensor is attached on the front door be sure to close the door before igniting 2 A gas leakage test window will now open so select Leak Test Total System and click OK NOTE The gas leakage test window opens when the FLAME ON OFF button is first pressed on that day And the start of measurement will not advance unless a leakage test is performed Make sure to perform a gas leakage test onc...

Page 73: ... and click Yes on the dialog Fig 3 28 Message to Close Gas Valve 5 Leak Test will appear on the instrument monitor bar and a gas leakage test will commence It takes about 5 minutes to complete the test Fig 3 29 Leak Test 6 When the test is finished the message will appear as long as there is no abnormality The OK button is clicked and the message is closed The instrument monitor bar will be in the...

Page 74: ...ng gas flow rate and other combustion conditions optimum for each element If the flame is low and soon goes out at ignition set a higher fuel gas flow rate prior to ignition 2 Since the solvent will become fuel in the case of an organic solvent sample measurement must be made with a fuel gas flow rate lower than the usual setting First perform ignition with the standard fuel gas flow rate for each...

Page 75: ...ammation of the respiratory tract Be sure to operate the ventilating fan to discharge the vapor emitted from the sample through the exhaust duct CAUTION Strong Magnetic Fields Be careful not to let your hand get attracted to the magnet Do not bring metal objects including iron such as a screwdriver near the magnet CAUTION Do Not Touch Hot Parts There is a danger of burns upon touching heated parts...

Page 76: ...h objects near the magnet CAUTION Deterioration of Burner Chamber by Chemicals A strong acid other than hydrochloric acid or hydrofluoric acid may damage the burner chamber Particularly avoid using concentrated nitric acid concentrated sulfuric acid or aqua regia since they will corrode the chamber For the acceptable solvents see section 2 in the Maintenance Manual 1 Inject the pure water and clic...

Page 77: ... the sample for a few seconds make sure the absorbance is stabilized and click Start Fig 3 33 Start Button The Start button on the spectrophotometer main unit may also be used NOTES 1 If no sample is set the Start button is shown grayed out and the measurement cannot be started 2 Use a capillary tube small when measuring an organic solvent sample The status is displayed during measurement Fig 3 34...

Page 78: ...s shown Fig 3 35 Status Indication 3 When measurement is finished Ready appears again on the instrument monitor bar and the Sample ID and Sample Name of the next sample to be measured are indicated Inject pure water and after making sure that absorbance has returned to 0 inject the next sample and click the Start button 4 Upon finishing the measurement of standard samples a working curve will be d...

Page 79: ...sired item on this menu Fig 3 36 Pop up Menu The function of each menu item is explained below Upon displaying a trace cursor on the graph readout values of the cursor appear simultaneously at the top of the graph The trace cursor can be moved by means of the mouse Clicking Trace once more on the pop up menu will delete the cursor This function is restricted by the monitor graph and can also be ac...

Page 80: ...ays Signal is displayed even when a sample is not under measurement It is recommended to use Always and check the baseline in the flame analysis mode 2 Signal Display monitor graph only ABS Display only an ABS signal REF Display only an REF signal ABS REF Display both ABS and REF signals REF reduction 1 4 Display an REF axis in a quarter space above the axis on the right side of the profile graph ...

Page 81: ...heck at Auto Scale the scale will be determined automatically in accordance with the signal When setting manually uncheck the Auto Scale and enter lower and upper limits in the Time Range column The time range is in seconds and can be set to a value from 0 to 5000 Division Select the method of entering scale divisions for the relevant axis Automatic Scale divisions will be entered automatically ac...

Page 82: ...h vertical and horizontal axes Auto scaling is executed only for the vertical axis The display is optimized The changed scale is returned to the original scale The object graph profile is printed The object graph profile is copied to a clipboard and can be pasted as an image 3 9 4 Y axis Auto Scale 3 9 5 Reset Scale 3 9 6 Print Graph 3 9 7 Copy Graph ...

Page 83: ...ion of the next measurement This can be done by clicking Overlay A profile is overlaid upon completion of each measurement The number of data points to be overlaid can be specified using No of Overlays The number of overlays can be set to a value from 1 to 100 This can be done by clicking The scale is automatically determined according to the signal strength Refer to 3 9 Changing the Display of a ...

Page 84: ...on of each item is described below Refer to 3 10 Changing the Display of a Monitor Graph and 3 12 Changing the Display of a Profile Graph Trace Refer to 3 9 1 Trace Ruled Line Refer to 3 9 2 Ruled Line Change Scale Refer to 3 9 3 Signal Change Scale Auto Scale Refer to 3 11 2 Auto Scale Vertical Axis Auto Scale Refer to 3 9 4 Y axis Auto Scale Reset Scale Refer to 3 9 5 Reset Scale Print Graph Ref...

Page 85: ...n By clicking Yes in response to the inquiry on whether you will close the sequence the window changes to the Data Process window and the measurement results are indicated If you will not conduct further measurements inject pure water for about 15 minutes press the FLAME button on the instrument to put out the flame and stop the flow of cooling water When exiting the software the following dialog ...

Page 86: ... software cannot be exited Refer to 5 11 Power Water Saving by Eco Mode Fig 3 41 Cooling Water Eco State To disable the Eco state click Disable Eco State in the toolbar on the data collection monitor screen Fig 3 42 Disable Eco State Button The Eco state can be disabled as follows Click Disable Eco State in Instrument Control in the menu bar ...

Page 87: ... spectrophotometer software cannot be exited Make sure to disable the Eco state before exiting the software 2 The water save mode is available only for the tandem type ZA3000 3 When the water circulator is used for cooling water it may cause breakdown of the water circulator Do not use the water saving mode function ...

Page 88: ...indow is composed mainly of Data Table Profile Graph Working Curve Graph and Instrument Monitor Bar commonly used with Monitor window As for Data Table Profile Graph and Working Curve Graph display area can be changed in size by dragging the boundary line with the mouse Fig 4 1 Data Process Window In the Data Process window the date of measurement 2 in Fig 4 1 is displayed and at the date and time...

Page 89: ... data Fig 4 2 Selection of Result File 4 1 Data Table In Data Table the numeric data of each sample is listed and various data editing operations can be performed There are 3 display formats of measurement result Data Tables Table of Each Element Detail Table and Concentration Table Each table is selectable by clicking the down arrow at the right of Data Table The sample IDs displayed in a data ta...

Page 90: ...here are many samples list display can be scrolled by clicking the scroll bar at the right of this table A hidden element is selectable by clicking the down arrow at the right of Element 2 Detail Table The repetitive measurement data of a selected element and a selected sample can be displayed A desired sample is selectable by clicking the down arrow at the right of Sample ID When there are many r...

Page 91: ...al is higher than 1 5 The background absorbance exceeds the allowable range of correction Dilute the sample or reduce the sample matrix A Sample signal is higher than 1 5 The linear range of general working curve may be exceeded though this depends on element So dilute the sample and measure again R Rollover has occurred due to high concentration This function is active in Manual mode Dilute the s...

Page 92: ... is appropriate or not Fig 4 3 Profile Graph When clicking the 1 sample display button above the graph only the result of the repetitive measurement of the sample its row highlighted in blue selected in Data Table is overlaid And when clicking the all profile overlay button all measured data is overlaid For specifying other measured data in the 1 sample display of Table of Each Element or Concentr...

Page 93: ...Overlaying You can select data to be displayed on the window 1 Click Overlay See Fig 4 5 Fig 4 5 Dialog Box for Specifying Overlaying Profile 1 2 Select in the Sample ID field a sample to be overlaid You can select randomly by clicking sample IDs while holding Ctrl on the keyboard ...

Page 94: ...ck OK You can select a sample ID from the Selected sample field and click Delete to move it back to the Sample ID field Overlaying all profiles Display atomized profiles of all measurement samples in a measurement data file Print Print out atomized profiles Copy Save the atomized profile window to the clipboard Shift baseline Change the position of the baseline 1 Click Shift baseline Fig 4 8 1 ...

Page 95: ...s and move it up and down to determine a new baseline position Fig 4 9 Profile Dialog Box 3 Click Setting baseline Fig 4 9 2 You can return to the original baseline position by clicking Reset Fig 4 9 3 Processing time You can configure and recalculate the range period of atomized data 1 Select samples to change the processing time by using Overlaying or Overlaying all profiles 2 Click Select start...

Page 96: ...o determine a new starting time position for atomized data Fig 4 11 Profile Dialog Box 4 Click Set start time Fig 4 11 2 5 Also set Select Completed Time 6 After determining the processing time range of period for atomized data click Recalculate Fig 4 11 3 The selected data are recalculated You can return data to the original position by selecting the data by Overlaying or Overlaying all profiles ...

Page 97: ...been measured a list of working curves can be displayed by clicking the Working Curve Preview button Then double click each graph and the details of the relevant working curve will be displayed Clicking the Trace button displays the trace cursor on a graph and concentration and absorbance values are indicated at the top You can read the values at the cursor position while dragging the trace cursor...

Page 98: ...ing curve is indicated DL stands for the detection limit obtained from the working curve data However no calculated value becomes available when the number of repeated STD measurements is only once Fig 4 13 Working Curve Detail Dialog Box 1 Changing the Order of Working Curve The order of working curve is changeable by clicking the down arrow in the Order input column at the bottom right of this w...

Page 99: ...fected For zero point shift set the ON status and click the Recalculate button The data subjected to zero shift can be reset to the original status by setting the OFF status and clicking the Recalculate button 5 Weighting Depending on the range of the working curve the results of measuring low concentration may be affected by the absorption level of the highly concentrated standard solution To red...

Page 100: ...ng the Concentration The value of concentration can be changed When changing it click the value of Conc and please input directly Click Recalculate for the update 7 Copying the Working Curve When clicking the Copy button the working curve graph can be copied into the clipboard The graph can be used as an image file 8 Printout of Working Curve Click the Print button and the working curve graph will...

Page 101: ...ment result can be saved as a file into the hard disk or other memory media 1 Click Save As in the File menu and a dialog box will open For saving the data for the first time after measurement the same dialog box can be displayed by clicking the Save Data File menu or the Save button on the toolbar Fig 4 14 Save As Dialog Box 2 By default Save in is set to Desktop My Document ZeemanAAS Data If sav...

Page 102: ...r file name for easier identification 4 Click the Save button When a file of the same name already exists a dialog box for confirming overwriting on the file is displayed Check the file name and then click the Yes or No button NOTE If you attempt to terminate the software application or close the Data Process window a dialog box appears to check whether you want the results saved When clicking No ...

Page 103: ...print the file name on the upper right side header of the printed result Printing the file name helps you sort out results printed in multiple pages Check the Data file name in the Header in Fig 4 15 1 Cick Report Format in the Data menu or click the Report Format button on the toolbar and the Report Format dialog box will appear Fig 4 15 Report Format Dialog Box 2 Click the Normal Form radio butt...

Page 104: ...Edit menu of the upper Menu Bar after closing the Report dialog box NOTES 1 When turning on the Graph check box in Profile the Auto Scale check box in Profile can be selected If the Auto Scale check box is removed ABS and REF range can be set up Input range 4 0000 to 4 0000 2 When turning on the Data check box in Profile all the absorbance data acquired by computer every 0 02 second will be output...

Page 105: ...isplayed Other pages can be viewed by the Next Page and Prev Page buttons displayed under the toolbar Utilize the Two Page simultaneous display of 2 pages Zoom In and Zoom Out buttons when required 9 When the contents of printout are appropriate click the Print button 10 Upon clicking the Print button the Print dialog box will open In most cases simply click the OK button When multiple printers ar...

Page 106: ...le is detailed below printing formats such as Method are the same among the tables 1 Printout with a Table of Each Element Displayed For each element the profiles due to repetitive measurement are overlaid in a single graph As numeric data only the mean values in repetitive measurement are indicated Fig 4 16 Profile Graph Printed from Table of Each Element under Display 4 4 3 Printing Format of Pr...

Page 107: ...epetitive measurement are put in order from the top For the numeric data the data due to each measurement cycle is printed When Output ABS statistic value in the Save data file field as described in Fig 4 15 of 4 4 2 Printout of Result is marked statistic values are also printed Fig 4 17 Profile Graph Printed from Detail Table ...

Page 108: ... Printout with a Concentration Table Displayed Profiles are not printed Only the mean concentration value of each unknown sample is listed Fig 4 18 Unknown Sample Data Printed from Concentration Table under Display ...

Page 109: ...e deleted In a Detail Table only the selected data of the ones resulting from repetitive measurement will be deleted 2 Click the Delete Data button at the right of a data table or click Delete Data in the Data menu 3 A dialog box for confirmation appears When deletion does not pose any problem simply click the Recalculate button 4 The deleted data is dimmed in the Data Table 5 To restore the delet...

Page 110: ...le or select the Concentration Correction command from the Data menu The dialog box will then appear In this dialog box change the concentration correction factor as desired and click the Recalculate button See Changing Sample Name as you cannot change the sample name in this procedure Click the Sample Name button at the right of a data table or click Sample Name in the Data menu A dialog box open...

Page 111: ...ata command from the Data menu Upon double clicking in the profile graph area or clicking Profile in the Data menu the profile dialog box is displayed to allow overlaying of profiles a single profile also allowed tracing and baseline specification For tracing left click on the Profile window to display the pop up menu See 3 11 Clearing the Monitor Graph for information on the usage The concentrati...

Page 112: ...mple UNK 001S but the analytical values of that sample remain unchanged For the samples after the sample blank analytical values after subtracting those of the sample blank will be indicated NOTE STD sample cannot be specified as a sample blank 4 For canceling the sample blank specification select the row of the corresponding sample and click Sample Blank Cancel Sample Blank in the Data menu 5 A d...

Page 113: ...ing your selections No file is available at this point as a file name to be generated is configured 5 Click the Output button at the bottom of the Report Format window and the file will be output to the specified location Confirm the folder and files configured in 4 Data can be output to Microsoft Excel in the same image as on a printer and output items can be rearranged freely However use of this...

Page 114: ...adio button by clicking turn on the buttons at the right of Template and Output File and specify the template copied above and the file at the destination of output 3 When selecting Data Output in the Output area only file output is effective When selecting Automatic Output printing starts simultaneously with file output 4 The file can be output to the specified location by clicking the Output but...

Page 115: ... graph and Variable beginning with The item list sheet displays a list of items The B to M columns 12 columns stand for the 12 elements settable in Analytical Condition 2 An actual output window is classified into another sheet depending on measurement mode and display in the data table Open the target sheet and you can change layout freely by deleting or moving Character string and Variable Sheet...

Page 116: ...nual Each Element EM_MANUAL_ELEMENT Detail Table EM_MANUAL_DETAIL Conc Table EM_MANUAL_CONC Header HEADER Instrument Setup INSTERCOND Analytical Condition Graphite Furnace ANALCOND_GA Flame ANALCOND_FL Temperature Program TEMP_PROG Standards Table WORKING_CURVE_TBL Autosampler Graphite Furnace ASCOND_GA Flame ASCOND_SSC110 Preparation Autosampler ASCOND_SSC400 Dil Factor UNK Preparation Autosample...

Page 117: ...instrument altogether WARNING Beware of Toxic Gas Inhalation of toxic gas could be injurious to human health Inhaling the vapor emitted from the sample may cause inflammation of the respiratory tract Be sure to operate the ventilating fan to discharge the vapor emitted from the sample through the exhaust duct WARNING Explosion due to Backfiring If water is not supplied to the drain trap there is a...

Page 118: ...king curve This method is employed for optimization of analytical conditions and other purposes 1 Using the Method window enter necessary parameters in Measurement Mode Elements Instrument Setup and Analytical Condition For details refer to Section 3 2 Click the Standards Table button to open the Standards Table window Fig 5 1 Fig 5 1 Standards Table Window 3 In the Determination Mode column turn ...

Page 119: ...ion is performed on the assumption that the linear relation is held through the concentration range to 0 Develop a working curve by adding to a certain amount of unknown samples a standard solution of a desired element after modifying the concentration This working curve is affected by co existing substances included in the unknown samples Fig 5 2 Fig 5 2 Working Curve in Standard Addition Method ...

Page 120: ...ater etc You can create working curves by taking into consideration the co existing substances as the STD includes the equal amount of the unknown samples Fig 5 3 Preparation of Aliquots in Standard Addition Method 1 Starting from the Method window make entries in the Measurement Mode window Elements window Instrument Setup window and Analytical Condition window For these entries refer to Section ...

Page 121: ...n a range where working curve is neither concave nor convex In addition STD1 concentration is required to be 0 5 Make entries for UNK Decimal Place and UNK Unit UNK Replicate in the standard addition method is fixed to 1 once Entry of another value will be neglected 6 Open the Sample Table window and specify 1 as the number of unknown samples and enter a sample name In the standard addition method...

Page 122: ...x composition Using the first unknown sample prepare aliquots by adding a series of standard solutions as shown in Fig 5 6 For the second and subsequent unknown samples prepare samples corresponding to only STD1 in Fig 5 6 5 1 3 Simple Standard Addition Method Ax 2 Ax 1 Ax Cx Concentration 0 C1 C2 C1 Standard addition temperature for unknown sample 1 1 C2 Standard addition temperature for unknown ...

Page 123: ... the Measurement Mode window Elements window Instrument Setup window and Analytical Condition window For these entries refer to Section 3 2 Click the Standards Table button to display the Standards Table window Fig 5 7 Standards Table Window Blank STD1 STD2 STD3 STD4 test Solvent Standard solution Unknown sample Blank solution ...

Page 124: ...concentration is required to be 0 5 Make entries for UNK replicate UNK Decimal Place and UNK Unit Note that UNK Replicate is applied to the second sample onward As the first sample a standard addition sample is measured according to the STD replicate count 6 Make entries in the Sample Table window In No of UNK set the number of samples including the first unknown sample 7 After verifying the metho...

Page 125: ...s significant the correction error will expand In this case it is advisable to draw the entire working curve again Correction of the working curve by the reslope function is carried out as follows when for example STD4 is specified for STD for Reslope and correction is made once every 10 samples 1 Creation of Working Curve Working curve n i i iC a A 0 A Absorbance C Concentration a Coefficient n O...

Page 126: ... A A 0 1 2 n i i iC a A A A 0 1 3 Setting is required as follows a Open the Standards Table window and turn on the Reslope check box b In STD for Reslope enter the name of standard sample used for correction c In Reslope Interval enter the sample interval for correction In common practice carry out reslope measurements at intervals specified above For starting reslope measurement at an arbitrary t...

Page 127: ...strument is now in the stop status due to clicking of the Stop or Pause button during measurement you should click the Close Sequence button Then the Data Process window will appear 2 In response to the confirmation message click the Yes button 3 Display changes to the Method window Change conditions such as the number of unknown samples if necessary Then verify the method and start measurement NO...

Page 128: ...nce by sensitivity variations such as use of the data just after measurement or combined use of the reslope function 1 For using the data just after measurement copy the analytical method referring to 5 3 2 For using the working curve in the saved data open the saved measurement result in the Data Process window and click the Copy Method button Reference 2 3 4 Opening a File 3 In response to the c...

Page 129: ...corresponding to the analyte element is double clicked the Working Curve Detail dialog box will open In this dialog box check the conditions of the working curve concerned 6 Click the Verify button and start measurement NOTE Since the atomic absorption photometry is subject to constant changes of sensitivity use the existing working curves measured as recently as possible ...

Page 130: ...surement is indicated in blue characters and a sample before measurement is indicated in black characters Select a sample before measurement by clicking its No entire row turns blue and click the Insert UNK button Then a sample will be added above that row NOTES 1 Even if a sample is added above the row of an already measured sample it will not be measured 2 For adding a sample on the last row cli...

Page 131: ... a measurement kept in pause click the sample to be remeasured in Data Table to turn its row blue 2 In the Measure menu click Remeasurement 3 A message for confirmation appears After your confirmation click the OK button 4 Click the Start button for measurement NOTES 1 After the relevant sample was remeasured measurement of the samples yet to be measured among the set ones will continue 2 Remeasur...

Page 132: ...urement 2 Clicking the Auto Start Setting button opens the Auto Start Setting dialog box In most cases it is not required to change the parameters in the Auto Start Setting dialog box If necessary adjust each parameter in this dialog box To restore adjusted parameters click the Reset button Fig 5 14 Auto Start Setting Dialog Box The relationship of the parameters in the Auto Start Setting dialog b...

Page 133: ...ent after waiting for the specified delay time The signal convergent width is specifiable at four levels according to the degree of absorbance and the delay time is specifiable at two levels 3 At the end of the current measurement the signal becomes lower than the end threshold level Then the computer recognizes that the current measurement has been completed and it waits for injection of the next...

Page 134: ...r window select the Auto Flame Off command from the Instrument Control menu 2 The Auto Flame Off dialog box will then appear Specify a value in the Delay Time entry box and click the OK button Fig 5 15 Auto Flame Off Dialog Box NOTE Since it also serves as cleaning after completion of measurement it is recommended to set the auto flame off waiting time to about 15 minutes Also make sure the amount...

Page 135: ...d below Also see Section 3 Measurement with Conditions Input 1 In the Measurement Mode window select Emission and Manual Fig 5 16 Measurement Mode Window 2 In the Elements window specify the element to be used for emission measurement The following elements are selectable for emission measurement ...

Page 136: ...Air acetylene flame used standard burner Li 670 8 Air acetylene flame used standard burner Mn 403 1 Air acetylene flame used standard burner Na 589 0 Air acetylene flame used standard burner Sr 460 7 Air acetylene flame used standard burner 3 In the Instrument Setup window specify the following items Wavelength Wavelength Setting Time Constant The time constant should be one second or more PMT Vol...

Page 137: ...the following reference values of element concentrations in standard samples for wavelength and intensity adjustments Alkali metals and alkaline earth metals Approx 10 mg L Other elements Approx 100 mg L 9 Check the Lamp Spectrum 10 While injecting pure water click the Auto Zero button The Auto Zero button on the spectrophotometer main unit may also be used 11 Measure the sample concerned In emiss...

Page 138: ... 21 to 3600 seconds set by the second Files are saved in the text format txt This function is convenient when numeric data are necessary for a long time 1 Click Start Data on monitor of the Measurement menu Fig 5 18 Fig 5 18 Measurement Menu Bar 2 Specify the destination to save and the file to save with the folder selection icon in the Monitor Data File field of the monitor measurement window Fig...

Page 139: ...e left while the reference signal intensity absorbance on the right The data sampling time is 0 157 seconds per point Execute 4 to suspend monitoring Fig 5 20 Monitor Measurement Data NOTE When monitoring begins using the same file name the data will be saved in a file named file name_yyyy_mmdd__hhmm_ss txt yyyy mm dd hh mm ss is the year month day hour and second upon completion of measurement in...

Page 140: ...5 9 Using Monitor Measuring Function 5 24 4 Click the execution cancel button to suspend monitoring Then a text file that contains the data until suspended is prepared ...

Page 141: ... will open automatically at start of the AAS software For newly creating a method after startup either radio button may be selected When the Open Latest Method File radio button is selected by clicking in advance the method file saved lastly will open at startup For opening a specific file click the Open Specified Method File radio button and then the Method File button and specify the file Commun...

Page 142: ...s function automatically carries out the procedure up to condition setting lamp lighting and wavelength adjustment in the set method To activate this function click the Set Conditions at Startup check box to put a check mark in it If this function is not used manual condition setting is required after verifying the analytical conditions ...

Page 143: ...f cooling water is stopped However the flow continues when the flame is on This mode is activated when no operation of the instrument is made for over 10 minutes NOTES 1 The water saving mode is available only on the Tandem model ZA3000 2 When the water circulator is used for cooling water it may cause breakdown of the water circulator Do not use the water saving mode function 1 Open Utilities on ...

Page 144: ... performed and click OK 4 Power off the instrument and put it back online with the PC NOTE The Eco mode function starts to run after getting back online When the energy saving mode is selected the lamp mark in the instrument status window is displayed in green Fig 5 24 Eco Status Power Saving Mode 5 11 2 Canceling Eco Status ...

Page 145: ...ig 5 25 Eco Status Water Saving Mode Click Cancel Eco status in the toolbar on the Data Collection Monitor window Fig 5 26 Eco Status Cancellation Button You can also cancel the Eco status in the following procedure Click Canceling the Economy Mode in Instrument control of the toolbar Fig 5 27 Running Utility ...

Page 146: ... Power Water Saving by Eco Mode 5 30 NOTE Be sure to cancel the Eco status as the software cannot be operated or the furnace atomic absorption spectrometry software cannot be terminated under the Eco status ...

Page 147: ...ile name and click the Save button Now the temporary data is saved formally under the selected file name 3 Open the Data Process window In the File menu click the Open Data File open the file saved in 2 and check the contents NOTES 1 Following a power recovery and after the restart of the AAS software the restoration of the backup file must happen before verification of any analytical conditions O...

Page 148: ...t the analytical result is appropriate According to the judgment you can remeasure the same sample as required In flame analysis when the method is set to manual or an autosampler with pretreatment QC functions can be used 1 Display the QC window by clicking the QC button 1 in Fig 6 1 in the Method window Fig 6 1 QC Window 1 ...

Page 149: ... data reprocessing operations cannot be specified Otherwise the data may change causing a disagreement with the message in QC measurement Change of working curve order change of STD concentration deletion of sample restore of sample exchange of samples calculation mode sample blank zero point shift of working curve baseline shift But in the case of working curve check only deletion restoration and...

Page 150: ... linear correction coefficient is used for judgment In case the order is quadratic or cubic determination factor is used Action Specify any of the processes below in case the correlation coefficient is smaller than the reference value After any process a message is printed in a report Continue Continues the sequence of unknown sample measurement End Interrupts measurement When an element to be mea...

Page 151: ...lected in Determination Mode Del Outer STD cannot be specified in Action The following messages are printed in the report Correlation coefficient is out of range Measurement is finished Delete a standard sample which deviates most from the working curve and create a working curve again STD is deleted represents an STD number deleted Re measure a standard sample which deviates most from the working...

Page 152: ...n allowable percent value above the Max limit concentration of working curve maximum concentration of standard sample In case the maximum concentration of standard sample is 10 mg L and the tolerance is 10 the range of calibration is limited to 11 mg L at maximum When the method is set to manual dilute the unknown sample that exceeded the permissible range and remeasure it When the method is set t...

Page 153: ...ple will be excluded from the RSD limit check The following messages are printed in the report The measurement concentration exceeds the effective range of the working curve Dilute the sample and remeasure it The sample concentration is too high it will be outside the range of working curve even if it is diluted RSD exceeded the permissible range go to the next step if the remeasured value still e...

Page 154: ... failure action according to specification Other permitted actions are continuing ignore failure or ending the sequence The permissible range is judged from the following expression Two different QC samples are supported you can specify QC Sample 1 and QC Sample 2 1 Click the check box for Check QC Sample Fig 6 4 STD Check Window 6 3 1 Setting Procedure Measured concentration QC sample concentrati...

Page 155: ... meet the tolerance Continue Continues the sequence of unknown sample measurement with a message End Terminates measurement for current element When an element to be measured next is set however it will be measured Rerun All STD Remeasures all standard samples and creates working curve again Then the measurement procedure will return to an unknown sample immediately after the previous QC sample me...

Page 156: ... performed after measurement of a group of unknown samples Therefore if the Next Element button or the Close Sequence button is clicked before measurement of the last QC sample a prompting message will appear asking for execution of QC sample measurement The following messages are printed in the report QC measurement value exceeds the permissible range Measurement is finished Measure all standard ...

Page 157: ...nitor window and Data Process window has the QC Message button on the toolbar Fig 6 5 QC Message Button Press this button by clicking and double click each data in Data Table Then QC message corresponding to the data will be displayed Fig 6 6 Display of QC Message ...

Page 158: ...ent element has not yet been completed you can start the measurement of the next element specified if more than 2 elements are specified in the measurement conditions 1 In the toolbox click the Next Element button Fig 7 1 Next Element Button 2 The lamp is now changed to the one for the next analyte element The element being measured displayed on the window changes to the next element 3 Click the S...

Page 159: ...ew methods or terminating the AAS program is not permitted 2 In the autosampler mode the sequence is automatically closed when measurement of the set samples is completed and display changes to the Data Process window 2 In response to the confirmation message click the Yes button Measurement result files are stored on a specified folder when the auto saving is set The measurement result finished i...

Page 160: ...ary message will appear Water pressure may be applied to the cooling line after the electromagnetic valve closes Be sure to stop the cooling water before working on the next task Fig 7 4 Dialog Box for Cooling Water 3 A message on the samplers left on the autosampler appears Be sure to get rid of any samples left on the autosampler ...

Page 161: ...efore working on the next task Fig 7 6 Dialog Box for Acetylene Gas 5 A message to terminate the atomic absorption spectrophotometer appears Click Yes to close Fig 7 7 Dialog Box for Terminating Software 6 If any measurement result data is not yet saved a confirmation message for saving will be displayed Select a data saving option NOTE If the No button is clicked in answer to the data saving conf...

Page 162: ...ch unit NOTE See the manual of the PC for shutting down the PC Finally follow these steps 1 Turn off power supply of the exhaust duct line 2 Remove the hollow cathode lamps 3 Close the main valves primary and secondary of each gas 4 Discharge waste solution This completes the last procedure to be taken at the end of daily operation of the instrument 7 4 1 Turning off Power Supply of PC and Instrum...

Page 163: ...strument is used longer however some performance items may be degraded due to deterioration of parts having a limited service life consumables or for similar reasons Therefore the performance needs to be checked Additionally certain parts require maintenance with periodic replacement or cleaning The method adopted in the instrument diagnosis function is a modified version of the inspection method ...

Page 164: ...ssion method NOTES 1 Any hollow cathode lamp other than made by Hitachi cannot be used for instrument diagnosis Use of other maker s hollow cathode lamp may result in failure to achieve exact diagnosis or a shortening of lamp life 2 If a hollow cathode lamp whose service life has already been expired is used instrument diagnosis may not be carried out correctly To avoid this be sure to use a hollo...

Page 165: ...ce due to noise drift in 5 minutes is measured to confirm that the permissible range is met 3 Sensitivity Copper Cu and calcium Ca standard solutions are measured and the measured absorbance at a specific concentration is checked to confirm it lies within the permissible range In the flame mode use the standard solution Cu 1 mg L In the emission mode use the standard solution Ca 1 mg L 4 Repeatabi...

Page 166: ... The Hg and Cu lamps should be set in No 8 and 7 respectively 2 Use the standard burner and provide the Air C2H2 flame 1 Click the Diagnosis button in the toolbox to display the Diagnosis window Fig 8 1 Diagnosis Button 2 Click the Measurement Mode button on the toolbar or Measurement Mode in the Method Setup menu The Measurement Mode dialog box opens In Measurement Mode select Flame Fig 8 2 Measu...

Page 167: ...3 Measurement Mode Dialog Box 3 You can enter desired characters for Operator Diagnosis Name and Comment Click the Next button for advance to the Diagnosis Conditions Dialog Box Fig 8 4 Diagnosis Conditions Dialog Box ...

Page 168: ...reshold the recommended values are listed These values are changeable if required except for Wavelength Accuracy Wavelength Accuracy 0 45 nm No change is allowed Baseline Stability Noise Input a permissible noise value in the change of absorbance with a time period of 5 minutes 0 003 to 0 02 Abs Baseline Stability Drift Input a permissible drift value of absorbance in 5 minutes 0 002 to 0 02 Abs S...

Page 169: ...a can also be output manually after completion of measurements If automatic output is not desired leave this check box off and click the OK button to close the dialog box For automatic output specify the following items Regarding Header Diagnosis Data Method and Profile click the check box of each desired item for output To turn off the check mark click it again Regarding Left Margin turn on one o...

Page 170: ... close the dialog box 1 After setting the conditions click the Verify button Fig 8 6 Verify Diagnosis Conditions Button 2 A message appears to check your intention of saving the conditions It is recommended to save the conditions here because they cannot be copied from the measured data in the instrument diagnosis mode For saving the conditions click Yes and specify the file location and name For ...

Page 171: ...agnosis menu Fig 8 9 Diagnosis Start Button 2 Carry out measurement according to the instruction messages to be presented on screen 1 In the manual mode click the Close Sequence button on the toolbox Fig 8 10 Close Sequence Button 2 The result of diagnosis is now displayed in the window The result of diagnosis on each item can be displayed by clicking the relevant diagnosis item tab in the window ...

Page 172: ...dd to Diagnosis Log in the Data menu Fig 8 12 Add to Diagnosis Log Button NOTE Instrument diagnosis does not have a file saving step So save its result via Add to Diagnosis Log 4 The past records can be displayed by the Previous and Next buttons in the dialog box displayed by clicking the Diagnosis Log button on the toolbar or Diagnosis Log in the Data menu Fig 8 13 Diagnosis Log Button ...

Page 173: ...8 3 6 8 11 Fig 8 14 Diagnosis Log Dialog Box 1 Click the Report button on the toolbar to open the Report Format dialog box Fig 8 15 Report Button 8 3 6 Output of Diagnostic Results ...

Page 174: ...rs click the Page No check box and mark the radio button for the desired inserting position In Output to select Printer or File Text or Excel format by marking the relevant radio button When either file is selected click the button at the right and specify the file saving location and file name 2 Click the Print Preview button and the print preview will be displayed Clicking the Output button will...

Page 175: ...s It however does not indicate sensitivity or deviation Check Judgment Results in the table 2 The wavelength setting method used for diagnosis is directly moved to the set wavelength This method depends on the precision of the wavelength drive mechanism and does not necessarily indicate the peak position of the lamp energy ...

Page 176: ...current Check the displayed lamp spectrum and then enter a proper numeric value Carry out condition setting again Wrong lamp element Check the lamp house and replace the lamp with a proper one Burner height maladjusted Check the burner height and adjust it properly Decrease in remaining amount of acetylene gas Check the pressure of the acetylene gas cylinder and replace it with a new one Atomizing...

Page 177: ...on For some elements add a matrix modifier Sample viscosity too high Aspirate the sample and check the degree of aspiration Decrease the viscosity of the sample by means of dilution or decomposition Baseline not stable Lamp deteriorated Check the displayed lamp spectrum and replace the lamp with a new one Lamp current improper Adjust the lamp current properly Wrong lamp element Check the lamp hous...

Page 178: ... Close sequence 7 2 Changing sample unit 4 24 Changing sample name 4 23 Check of instrument 1 1 Concentration Table 4 2 Comment 4 5 Continuous measurement 3 10 Copy method 5 11 D Data file 2 9 Data Table 4 1 Delay time 3 9 Detail table 4 2 Diagnosis 8 1 E Existing working curve 5 12 Eco mode 5 26 Exchange samples 4 23 F Flame measurement 5 21 ...

Page 179: ...w cathode lamp 1 2 L Lamp Spectrum 3 27 Lamp current 3 7 M Menu bar 2 5 Method file 2 9 Monitor measuring function 5 22 O Offline 2 2 Online 2 2 P Power switch 1 5 PMT voltage 3 7 Profile graph 4 1 Q QC function 6 1 QC message 6 10 R Reslope 5 8 Repeatability 8 1 S Sample blank 4 17 Sensitivity 8 3 ...

Page 180: ...ditions 3 26 Simple standard addition method 5 6 Slit width 3 6 Status bar 2 6 T Table of each element 4 2 Template 4 26 Time constant 3 7 Toolbox 2 5 Toolbar 2 5 Troubleshooting 9 1 V Verify 3 21 W Wavelength accuracy 8 1 Working curve graph 4 1 ...

Page 181: ...PERATION MANUAL GRAPHITE FURNACE ATOMIZER Hitachi High Technologies Corporation 24 14 Nishi Shimbashi 1 chome Minato ku Tokyo Japan 2nd Edition November 2012 Copyright C Hitachi High Technologies Corporation 2012 1st Edition 2012 All rights reserved Printed in Japan Part No 7J1 9005 1 HF TH FH HMS ...

Page 182: ...arty in any form or by any means without the express written permission of Hitachi High Technologies Corporation 3 Hitachi High Technologies Corporation assumes no liability for any direct indirect or consequential damages arising from use not described in this manual Utmost care must be exercised when using the instrument 4 This document does not provide any warranty or permission for industrial ...

Page 183: ...is instrument ABOUT THIS MANUAL This instruction manual for Hitachi ZA3000 Series consists of 3 manuals below Maintenance manual for Hitachi ZA3000 series polarized Zeeman atomic absorption spectrophotometer Instruction manual for Hitachi ZA3000 series polarized Zeeman atomic absorption spectrophotometer flame analysis edition Instruction manual for Hitachi ZA3000 series polarized Zeeman atomic ab...

Page 184: ...ally For evading possible injury or death every safety message that follows this symbol shall be obeyed DANGER Indicates an imminently hazardous situation which if not avoided will result in death or serious injury WARNING Indicates a potentially hazardous situation which if not avoided can result in death or serious injury CAUTION Indicates a potentially hazardous situation which if not avoided m...

Page 185: ...inal usage of the product and the usage specified in this manual Never attempt modification of the instrument use of a part other than specified and instrument operation with safety devices released because they are dangerous Do not perform operations other than those described in the instruction manual If any problem occurs on the instrument contact our sales representative or service office In a...

Page 186: ... be unobtainable but also personal injury may be caused Precautions on Use In analysis with the atomic absorption spectrophotometer flame ignition or atomizer furnace heating is performed A fire or explosion may be caused if operation is carried on in an abnormal condition such as abnormal sound abnormal odor smoke or gas leak Be sure to carry out analysis in the presence of the analyst Avoid unat...

Page 187: ...nt instructions carefully Never attempt maintenance not described in the manual Failure to do so could cause malfunction of the instrument or personal injury Avoid moving the instrument after installation This might result in deviation of the precisely adjusted optical system may get out of order due to vibration etc If a warning label is deteriorated due to secular change or damaged contact our s...

Page 188: ... are listed below List of DANGER Indications Malfunction of Pacemaker There is a danger of faulty operation of a pacemaker due to the strong magnetic field produced A person who uses a pacemaker should not come within 1 meter of the instrument or should avoid handling the instrument altogether Sections 1 3 5 and 8 in this manual ...

Page 189: ...efore replacing the lamp be sure to turn OFF the lamp current click the lamp OFF button Sections 1 and 5 in this manual Beware of Toxic Gas Inhalation of toxic gas could be injurious to human health Inhaling the vapor emitted from the sample may cause inflammation of the respiratory tract Be sure to operate the ventilating fan to discharge the vapor emitted from the sample through the exhaust duct...

Page 190: ...ler Section 3 in this manual Ignition of the Graphite Furnace There is a danger of ignition and resulting burns due to residual moisture If moisture remains in the graphite furnace after cleaning the interior the moisture may be decomposed and produce a hydrogen flame when heating the unit So if water is spilled or cooling water leaks be sure to wipe it up thoroughly Sections 1 3 5 and 8 in this m...

Page 191: ...on Do not look directly at the light from the hollow cathode lamp Sections 3 and 8 in this manual Do Not Touch Hot Parts There is a danger of burns upon touching heated parts The graphite atomizer is at a very high temperature Before replacing the cuvette or ring wait for over 10 minutes until the cover of the graphite furnace and the cuvette etc cool down Sections 1 and 5 in this manual There is ...

Page 192: ... Indications Strong Magnetic Fields The graphite furnace utilizes a magnet The strong magnetic field produced may cause damage to a watch magnetic card and so on Avoid bringing such objects near the magnet Sections 1 3 5 and 8 in this manual ...

Page 193: ... Intense Light SAFETY 8 Do Not Touch Hot Parts SAFETY 8 List of CAUTION Indications SAFETY 9 Strong Magnetic Fields SAFETY 9 1 STARTUP 1 1 1 1 Check of Instrument 1 1 1 2 Mounting Hollow Cathode Lamp 1 2 1 3 Supply of Gases 1 4 1 4 Graphite Cuvette Installation 1 5 1 4 1 Selection of Graphite Cuvette 1 5 1 4 2 Mounting of Graphite Cuvette 1 7 1 5 Power on 1 10 1 6 Power on Exhaust Duct 1 11 1 7 Ba...

Page 194: ... Report Format 3 41 3 1 11 Check of Analytical Conditions 3 42 3 2 Verification of Measurement Condition 3 44 3 3 Monitoring of Measurement Process 3 47 3 4 Wavelength Adjustment 3 53 3 5 Preparation for Autosampler 3 55 3 5 1 Supply of Rinse Water 3 55 3 5 2 Flowing Rinse Water 3 55 3 5 3 Nozzle Adjustment 3 55 3 5 4 Setting of Sample Cups 3 58 3 6 Flowing of Cooling Water 3 61 3 7 Cleaning of Gr...

Page 195: ...4 21 4 5 Analysis and Recalculation of Data 4 24 4 5 1 Deleting and Restoring Data 4 24 4 5 2 Exchanging Data 4 25 4 5 3 Changing Calculation Mode 4 25 4 5 4 Changing the Concentration Correction Factor 4 25 4 5 5 Changing Sample Name 4 25 4 5 6 Changing Sample Unit 4 26 4 5 7 Changing Digits Below Decimal Point 4 26 4 5 8 Editing Reagent Name 4 26 4 5 9 Restoring the Recalculated Results 4 26 4 5...

Page 196: ...Using an Existing Working Curve 5 40 5 14 Insertion and Remeasurement of Sample 5 42 5 14 1 Insertion of Samples 5 42 5 14 2 Remeasurement 5 45 5 15 Setting Automatic Start 5 46 5 16 Power Water Saving by Eco Mode 5 48 5 16 1 Setting Eco Mode 5 48 5 16 2 Canceling Eco Status 5 49 5 17 Restoring Data Lost due to a Power Failure 5 51 6 USING THE QC FUNCTIONS 6 1 6 1 Using Correlation Coefficient of ...

Page 197: ...ation for Measurement 8 2 8 3 Flowing of Cooling Water 8 3 8 4 Cleaning of Graphite Cuvette 8 4 8 5 Memorizing Optical Temperature Control Equation 8 5 8 6 Start of Measurement 8 6 8 6 1 Starting Measurement 8 7 8 6 2 Interrupting a Measurement 8 8 8 7 Terminating or Continuing Measurement 8 10 8 7 1 Continuing Measurement with Element Change 8 10 8 7 2 Terminating Measurement 8 10 8 7 3 Stopping ...

Page 198: ...Temperature Program Test Conditions 10 2 10 2 Start of Measurement 10 18 10 3 Heating Temperature Graph 10 19 10 4 Judgment Standards for Automatic Generation of Temperature Program 10 20 10 5 Reflecting on Analysis Conditions 10 22 11 TROUBLESHOOTING 11 1 INDEX INDEX 1 ...

Page 199: ...ng the already mounted graphite cuvette make sure the cuvette is mounted exactly between the electrode rings the cuvette has not yet been deteriorated and its sample injection port faces upward Various types of cuvettes are available Be sure to check the type before using it For mounting the cuvette newly follow the instructions given in 1 4 Graphite Cuvette Installation 4 Is the waste solution bo...

Page 200: ... mounting or replacing the lamp be sure to turn OFF the lamp current click the lamp OFF button NOTE Prior to handling hollow cathode lamps carefully read the cautionary instructions provided with them When the power supply to the main unit of instrument is turned off the lamp turret can be turned manually Mount hollow cathode lamps at lamp positions Nos 1 to 8 while turning the lamp turret clockwi...

Page 201: ...secured properly it may snag on another lamp and cause motor malfunction or break a lamp 2 The lamp made by Hitachi High Technologies should use HLA 4 type Since as for the old products HLA 3 type etc the lamp code may be caught it cannot be used 3 The lamp current values stored in this instrument are those for the hollow cathode lamps made by Hitachi High Technologies If using the lamps of anothe...

Page 202: ...ing the course of analytical operation an error is detected and measurement is interrupted 2 When ordering argon gas specify dry argon gas purity 99 95 or higher Argon gas having a lower purity may contain moisture The moisture contained in argon gas will be heated at a high temperature and react with the graphite cuvette so the service life of the cuvette may shorten 2 Open the main valve of each...

Page 203: ...ng and analysis of solid and powdery samples However maximum temperature is limited to 2 100 C due to structural reason so this cuvette is usable only for analyzing elements which can be atomized at 2 100 C or lower Even though the cuvette is set above 2100 C its temperature will not reach it Its sensitivity is lower than the Tube HR cuvette Platform HR Cuvette Used with a plate shaped platform in...

Page 204: ...aphite furnace operations is displayed on the monitor window Before start of measurement check the displayed number and replace the graphite cuvette with a new one when necessary Note that attention should be paid to the progress of deterioration of the graphite cuvette since its lifetime varies with sample constituents In analyses of samples similar to an aqueous solution the Pyro Tube HR has an ...

Page 205: ...illed or cooling water leaks be sure to wipe it up thoroughly CAUTION Strong Magnetic Fields Be careful not to let your hand get attracted to the magnet Do not bring metal objects including iron such as a screwdriver near the magnet CAUTION Strong Magnetic Fields The graphite furnace utilizes a magnet The strong magnetic field produced may cause damage to a watch magnetic card and so on Avoid brin...

Page 206: ... in close contact with the tapered area of electrode rings NOTES 1 There is a danger of burns upon touching heated parts The graphite atomizer is at a very high temperature Before replacing the cuvette or ring wait for over 10 minutes until the cover of the graphite furnace and the cuvette etc cool down Open the lid of graphite atomizer unit holding its white resin part 2 Be sure to mount the grap...

Page 207: ...e cover of the unit when heating and performing measurement CAUTION Do Not Touch Hot Parts There is a danger of burns upon touching heated parts The graphite atomizer is at a very high temperature Before replacing the cuvette or ring wait until the cover of the graphite furnace and the cuvette etc cool down CAUTION Beware of Intense Light An intense light is emitted from the cuvette which could da...

Page 208: ...peripheral devices such as printer that are connected to the instrument 2 Turn ON the power switch on the front right of the atomic absorption spectrophotometer Fig 1 3 Then start up the PC Fig 1 3 Power Switch NOTE After the spectrophotometer power is turned ON the instrument is initialized for about 15 seconds Start up the PC or start the atomic absorption spectrophotometer software after the in...

Page 209: ...e air volume of the exhaust duct should be 10 25m 3 hr Adjust the air volume by using the damper etc if the volume is large Large air volume may cause the argon gas sheath gas which is used to protect a cuvette to be sucked in too much resulting in shorter service life of the cuvette WARNING Beware of Toxic Gas Inhalation of toxic gas could be injurious to human health Inhaling the vapor emitted f...

Page 210: ...rking Curve of the QC function is validated Working curve check 2 Check of instrument and preparation of hollow cathode lamp gas and graphite cuvette Power on of PC spectrophotometer main unit and duct Start of AAS program Setting of measurement conditions Execution of Set Conditions Setting of sample 1 Supply of gas cooling water Start of measurement Measurement of standard sample Measurement of ...

Page 211: ...wer to the spectrophotometer main unit wait for over 15 seconds and then double click the shortcut icon Zeeman AAS Fig 2 1 on the PC window Fig 2 1 Shortcut Icon of ZeemanAAS 2 The initialization window appears and the atomic absorption spectrophotometer program is started Fig 2 2 Initialization Window ...

Page 212: ...be set to online status for conducting measurement There are two methods for selecting online status at startup of the instrument For selection of the methods refer to 5 11 Setting Automatic Start Described next are two procedures at startup of the instrument 1 The Method window in Fig 2 3 appears and online processing starts automatically process in which communication with the spectrophotometer ...

Page 213: ...lowing Fig 2 5 Dialog Box for Checking Water Flow Leak The instrument turns to online status only after the instrument is powered on and the initialization is completed about 15 seconds When Communicate with Instrument at Startup is selected power on the instrument so the initialization of the instrument is completed before the software is started If the instrument fails to turn to online status l...

Page 214: ...ting the online status click On line in the Tools menu of the Menu Bar see Fig 2 6 The progress of the initialization can be checked via the time bar to be displayed while online Fig 2 4 Then check any water leak Fig 2 5 Fig 2 6 Execution of Online Processing 2 2 2 When Communicate with Instrument at Startup is Not Selected ...

Page 215: ... position click the left mouse button twice in a row The atomic absorption spectrophotometer software has 4 windows Monitor window Method window Data Process window and Diagnosis window Switch windows by pressing the lower left button Taking an example of the Method window the name and function of each window element are described here Displayed around the edges of the window are 1 menu bar 2 tool...

Page 216: ... key in the underlined letter of the menu item name Example Press Alt F to select File Upon selecting the menu item the commands included in it are displayed as in Fig 2 8 Fig 2 8 Example of Menu 2 Toolbar Located just under the menu bar It contains a number of small buttons arranged horizontally These buttons are used for executing commands or functions of the atomic absorption spectrophotometer ...

Page 217: ... displayed with respect to mouse pointer or cursor position Allowable input range for item Description of toolbar or tool box buttons Description of command For setting the instrument conditions for atomic absorption spectrophotometer click the necessary button to open a window and then display data or enter numerical values A number of input methods are available as described below 1 Selection am...

Page 218: ...he display as shown in Fig 2 10 clicking the down arrow presents a list of input values Move the cursor to the desired value or item and click to select it Fig 2 11 Example of Numeric Value Selection 4 Input of Numeric Value In the display as shown in Fig 2 12 double clicking the numeric area allows direct input of a numeric value The settable range of numeric value will be displayed on the status...

Page 219: ...Click the Open button on the toolbar or click Open Method File or Open Data File in the File menu The file opening dialog box as shown in Fig 2 14 will open When no single data file is opened click Data in the toolbox to open a dialog box for directly reading files 2 In Look in specify the folder which contains the target file Default method file Library Document ZeemanAAS Method Default data file...

Page 220: ...ay format can be selected The files saved in the specified folder are displayed in the field under Look in In this case only the files of the type specified in Files of type are displayed If the specified type of a file is wrong the file will not be displayed though it exists For changing the type of file click the down arrow at the right of this field and select the desired one 3 Click the desire...

Page 221: ...ocument ZeemanAAS Method Default data file Library Document ZeemanAAS Data If a different location is stored after file opening or saving at any location other than default a change may be required 3 Input file name and click the Save button By default a method file has the name Analysisyyyy_mmdd_hhmm_ss amg yyyy mm dd hh mm ss denotes the date and time point of creating a new copy of the method a...

Page 222: ...etailed explanation 1 Calling Help for Window Clicking the Help button in the toolbar of the Method window displays the help for the presently open window Clicking a description with a green underscore displays the help for that description Fig 2 16 Fig 2 16 Example of Help Button on Element Setting Window 2 3 6 Asking for Help ...

Page 223: ...6 2 13 Clicking the Help button Fig 2 17 in the dialog box opened through operations on the Method window displays the Help window Fig 2 18 Fig 2 17 Example of Help Button in Dialog Box Fig 2 18 Help Window ...

Page 224: ...rophotometer will be displayed Fig 2 19 When you click a description with a green underscore among the help items new help items appear 3 Searching with Keyword Input the characters to be searched in the keyword input box on the Help window and the searched keywords will be displayed Select the objective item and click the Display button The relevant help will be displayed Fig 2 19 Help Window ...

Page 225: ... When changing the measurement conditions read out from the existing file Reference 2 3 4 Opening a Files For creating measurement conditions open the Method window Fig 3 1 then open the windows in succession by clicking the buttons on the toolbar from left to right and enter your settings For changing over the windows for entry either click the respective buttons or use the Previous and Next butt...

Page 226: ... displayed 2 Click the down arrow 12 in Fig 3 1 at the right of Sample Introduction to display the list of selectable methods In the list click Autosampler 3 For Operator Analysis Name and Comment desired characters can be input after clicking each input box However analysis can be carried out with no inputs in these fields Also Operator Analysis Name and Comment can be corrected in Parameter List...

Page 227: ... Measurement in the Element Order click the check mark in the Measurement column The row will remain in the table but measurement will not be carried out Click Delete Click No in the Element Order column for the element to delete to change the color of the row of the element to blue 3 in Fig 3 2 Click the Delete button Click the Delete All button to delete all elements in the Element Order column ...

Page 228: ...b 1 in Fig 3 3 such as 1 Mg 2 Cr 3 Mn on the window The following condition input is required for all the set elements 3 Set the following items Signal Mode BKG Correct is normally used and need not be changed BKG Correct Measurement is made using background correction signal obtained by subtracting reference signal from sample signal via the polarized Zeeman method Sample Measurement with uncorre...

Page 229: ...second Used mainly for flame or emission mode Peak Width Calculation of the width of time when the maximum absorbance of STD 2 is sliced at the specified height in In the subsequent measurements the absorbance at the slicing height which gives the said time width is obtained and based on the absorbance quantitative calculation is carried out The input range of the slicing height is 1 to 50 Wavelen...

Page 230: ...ing on the condition and use it only as a guide 2 In same cases it is necessary to change the slit width according to wavelength for the separation of the neighboring line Change the slit width referring to the recommended slit width described in ANALYSIS GUIDE Chapter 7 ELEMENTAL DATA Wavelength Setting Normally set at Automatic and need not be changed Automatic A peak of lamp energy near the mea...

Page 231: ...Time Constant Time constant expresses the degree of signal smoothing A larger time constant provides a reduced noise but a damped rise of the signal For measurement with the graphite atomizer a value of 0 1 second is normally used and there is no need for change from this value Available settings 0 02 0 05 0 1 0 2 0 5 1 0 2 0 5 0 10 0 20 0 Lamp Current By default the optimum value for the set elem...

Page 232: ...PMT voltage at measurement differs largely from the setting specification of a value close to the measurement voltage will shorten the condition setting time Input range 1 to 1000 V Absorbance Decimal Place Normally this is set at 4 digit 5 digit may be set for detecting a very small change in absorbance when there is very little noise for instance The decimal place can be changed after completion...

Page 233: ...ple inlets Make sure to check the cuvette type before use 3 If Pyro Tube D HR Twin Cuvette is selected a dialog box to adjust the nozzle position will appear when determining the conditions Follow the instructions in the dialog box 4 The heating temperature changes with the change in the resistance of the cuvette Do not use a cuvette other than those specified for this instrument Temperature Contr...

Page 234: ...nized in the dry ash stage dry ash stage A matrix modifier has been added ash and atomize stages It is desired to change the measurement concentration range by increasing or decreasing the carrier gas atomize stage If bumping is recognized in the dry stage then the most likely cause is that the temperature of the cuvette was raised too fast Set a slightly longer ramp time about 10 s If a matrix mo...

Page 235: ...llowed up to 2800 C on the window temperature will not rise beyond the above limits due to the relationship between cuvette shape and resistance End Temp Set the end temperature of dry and ash stages You cannot enter each end temperature of atomize and clean stages because the temperature will be automatically set at the same temperature as for start Dry 50 to 1000 C Ash 50 to 2800 C Atomize 50 to...

Page 236: ...ime less than 100 s 2000 C Cuvette temperature 2500 C The sum of the ramp time and the hold time less than 25 s 2500 C Cuvette temperature 2800 C The sum of the ramp time and the hold time less than 20 s 2800 C Cuvette temperature The sum of the ramp time and the hold time less than 10 s Gas Flow Specifies the flow rate of carrier gas For stages other than atomization set 200 mL min usually for pu...

Page 237: ...target stage so that the entire row of the number turns blue Then click the Recall button For deleting the set stage also click the number of the target stage so that the entire row of the number turns blue and then click the Delete button 4 Other functions Copy Dry Stage Setting of the Dry Stage of selected analyte element can be copied Since the dry stage is determined by the properties of the s...

Page 238: ...3 1 Generation of Measurement Conditions 3 14 Fig 3 6 Copying the dry stage 1 The setting of Dry Stage will be copied and the Paste Dry Stage button will be enabled Fig 3 7 Copying the dry stage 2 ...

Page 239: ...e Dry Stage Click the tab of the analyte element for which the drying stage setting is to be pasted Fig 3 8 Pasting the dry stage 1 Click the Paste Dry Stage button and the copied setting of Dry Stage will be pasted 1 ...

Page 240: ...g temperatures stepwise Since multiple temperature program patterns can be automatically measured sequentially this function can be used to examine a temperature program to determine analytical conditions For details refer to 10 Temperature Program Development Function Bumping Detection of the sample In the dry stage the bumping of the sample due to rapid heating is detected from the obtained sign...

Page 241: ...duce the memory effect of the previous measurement on the next measurement by heating the cuvette Two methods are available for heating the cuvette heating the cuvette to the maximum temperature and heating it according to the temperature program For details refer to 5 6 Cleaning Cuvette in Chapter 5 1 Click the Standards Table button 5 in Fig 3 1 to display the Standards Table window Fig 3 10 Sta...

Page 242: ...r coexisting materials are quantified with one working curve Specify Working Curve here For the details of Absorbance STD Add and Simple STD Add refer to 5 1 Various Measurement Methods Order Specify the order of working curve Linear or Quadratic is normally selected In graphite furnace analysis the working curve generally tends to be bent above an absorbance of 0 2 to 0 3 which differs from one e...

Page 243: ...ents of the same sample Input range is from 1 to 20 STD Decimal Place Specify the number of digits under decimal point Input is effective within a range from 0 to 4 Input can be changed after measurement Refer to 4 5 7 Changing Digits below Decimal Point STD Unit Enter the concentration unit for the standard solution Measurement can be made even if this is omitted Also the unit can be changed at t...

Page 244: ...Curve Specify the use of an existing or saved working curve The sensitivity changes with the state of the instrument Use the latest possible working curve The accuracy of analysis values is lower than that of normal measurements Usually saved working curve is not used and a new working curve is created for measurement of an unknown sample This item is shown grayed out when there is no saved workin...

Page 245: ...ed in up to 6 characters Even if this input is omitted measurement can be performed Also input can be changed after measurement 1 Click the Sample Table button 6 in Fig 3 1 to display the Sample Table window Fig 3 11 If Sample Name Conc Correct display is not contained in this window the Sample Name Conc Correct tab 1 in Fig 3 11 must be clicked for the display Fig 3 11 Sample Table Window 3 1 7 S...

Page 246: ...e table is reset Change button Used to change the No of UNK of Number of Samples This should be used to change the number of samples while leaving the data on ID Sample Name Weight Solvent Dil Factor and Factor of the entered sample table The method of changing the sample table varies according to the relationship between the number of samples in sample table and the entered No of UNK a When the e...

Page 247: ...he entered No of UNK is smaller than the number of samples in sample table Example of execution Click Change button with 10 set for number of samples in sample table and 5 set for No of UNK Fig 3 14 Change of Sample Table 3 The number of entered No of UNK from the head No 1 of the sample table is left and the UNK sample after that is deleted Fig 3 15 Change of Sample Table 4 ...

Page 248: ...mples is set to ID 1 of the previous sample of the sample that has been selected blue Example of execution Select No 4 of the sample table and click the Insert UNK button Fig 3 16 Insert of UNK Sample 1 The UNK sample is inserted in the sample table The ID of the inserted sample becomes 4 Fig 3 17 Insert of UNK Sample 2 NOTE The ID of the inserted UNK sample must change so as not to overlap with t...

Page 249: ... sample names are omitted Also sample names can be entered or edited after the end of measurement 4 For entering a common sample name use the UNK Common Name column at the lower right of the window Next click the No part of the object sample with the mouse while holding down the Shift or Ctrl key and this row will turn blue then click the Set button To add successive numbers after the sample name ...

Page 250: ...e with the mouse while holding down the Ctrl key and only those rows will be selected as indicated in Fig 3 21 Fig 3 21 Row Selection Method 2 with automatic numbering 5 For setting the standard sample name click the STD Sample Name button to open the entry window and enter sample names the same as with unknown samples The BLANK indicated here is a blank solution for use as a reference when using ...

Page 251: ...for concentration correction is not particularly required then changes need not be made 1 is entered in all items Recalculation upon changing the factors can be made at the end of measurement Concentration is calculated according to the formula below C C0 L W D F C Concentration in original substance C0 Measured concentration W Weight L Solvent volume D Dilution factor F Correction factor When the...

Page 252: ...olved in 100 ml of the solvent is measured The concentration of the target element in sample A is calculated when the obtained concentration of the element is C0 mg l C0 mg l 100 ml 1 000 mg C mg g Concentration of the target element in sample A The unit for the measured concentration is mg l but the unit for the corrected concentration is mg g 7 Setting of Measurement Object Click the Measure Obj...

Page 253: ...imilarly click the relevant row and when it turns blue click the row again or click the Not Measure UNK button 1 Click the Autosampler button 7 in Fig 3 1 to display the Autosampler window Usually the Sample Injection window appears as shown in Fig 3 24 However if other input window is open click the Sample Injection tab 1 in Fig 3 24 at the top to display the Sample Injection window Fig 3 24 Auto...

Page 254: ...lue Then click the Set Dil Factor to All Samples button Example Dilution factor of 2 and 20 μl of an unknown sample 10 μl of the solution is taken from the cup containing the sample and 10 μl of the diluent is taken from cup No 60 can be changed The two fluids are mixed in the cuvette making 20 μl in total Thus the solution is diluted by a factor of 2 As the dilution factor increases the amount of...

Page 255: ...0 L Tube HR or Tube C HR or Cup HR 1 to 50 L Platform HR 1 to 100 L Pyro Tube D HR 1 to 40 L one side NOTES 1 When Inner is specified for the standard addition method or simple standard addition method each STD sample of the same volume as the set sample injection volume will be injected in addition to the set volume This means that sample will be injected in a volume twice as large as the set sam...

Page 256: ...aspiration injection speed is listed in the table below Specification of 4 does not pose a problem usually However the speed should be slowed as required for pipetting of a highly viscous sample or the heating injection described below Specification No Aspiration Injection Speed L s 1 2 2 6 3 19 4 30 5 60 Continuous injection When measurements are made by the autosampler with multiple samples a sa...

Page 257: ...sampler Inner or preparation of standard added sample Outer and the cup position of blank solution Refer to 5 1 2 Standard Addition Method In furnace addition or 5 1 3 Standard Addition Method ex furnace addition This item does not concern the working curve method STD Cup No Click the Cup No column of each STD sample and enter the cup position number for each STD sample on the autosampler rack Sto...

Page 258: ...s effective within 50 to 200 C Cuvette cleaning After completion of each measurement heat and clean the cuvette to reduce effects on the next measurement When using cuvette cleaning refer to 5 6 Cleaning Cuvette Auto Sequence close When the measurement of all elements is finished the message inquiring whether you will terminate the measurement sequence appears if a check mark is not placed Fig 3 2...

Page 259: ...e holder For details of setting refer to the instruction manual of the holder 3 Setting of Modifier Addition For adding a matrix modifier click the Modifier QC Cup No tab 2 in Fig 3 24 at the top of window to open the input window See Fig 3 20 Available cup positions are limited to 52 M1 54 M2 56 M3 and 58 M4 on the tray A and 97 M1 98 M2 99 M3 100 M4 on the trays B and C Click the check box in th...

Page 260: ... the sample and Pre to suppress the interaction between the surface of the cuvette and the sample Fig 3 26 Autosampler Window Modifier QC Cup No NOTES 1 Modifier is added to both unknown and standard samples 2 Total volume of injection into a graphite cuvette is given by the sum of total addition volume of modifiers 1 to 4 Sample Injection Vol This volume should not exceed the injection volume all...

Page 261: ...op of window to open the input window Fig 3 27 In the Cup No column enter the number on each tray which is assigned to the target sample By default sample cup numbers are all 1 Unless changed a double assignment error message will be displayed Double assignment with a standard sample and other samples must also be avoided otherwise an error message will be displayed Usually employ the auto numberi...

Page 262: ... following way See Fig 3 28 First input the cup No of the leading sample for editing Next click the No column of that sample to select the row entire row turns blue Then specify a range by clicking the number of the last sample for editing with the Shift key held down or select the rage by clicking individual sample numbers one by one with the Ctrl key held down And click the Edit Selected Area bu...

Page 263: ...4 in Fig 3 24 at the top of window and a map showing the arrangement of measurement cups will be displayed Fig 3 29 On the map make sure the cup positions of the samples to be measured are assigned properly This map display is used only for check and will not accept any change 1 2 3 Enter a cup number Select Click ...

Page 264: ...the symbols listed in the table below are used Sample cup symbols in map display Symbol Sample Name S1 to S10 Standard samples 1 to 10 A1 to A3 Stock STDs 1 to 3 M1 to M4 Modifiers 1 to 4 U Unknown sample B Blank test solution QCS QC sample R Spike sample NOTE Restriction on double specification of cup No ...

Page 265: ...ION Click the Report Format button 9 in Fig 3 1 to display the Report Format dialog Auto printing at the end of measurement and the items to be printed can be selected here When auto printing is not specified printing can be made upon selecting the desired items at the end of measurement Given here is a simple example where auto printing is not made In this case the procedure is advanced without s...

Page 266: ... made In this case the procedure is advanced without setting anything on the Report Format dialog Click the Parameter List button 10 in Fig 3 1 and a list of conditions will be displayed to allow check of the main set parameters Display is changeable by the Conditions for Each Element and Common Conditions tabs at top of this window In particular confirm that the number of measurement repetitions ...

Page 267: ...3 1 11 3 43 Fig 3 31 Parameter List Window Common conditions The setting of method is thus completed ...

Page 268: ...r to 5 12 Measurements under the Same Conditions Copy Method Click No if you will not save the analytical conditions 3 If the window for adjusting the nozzle position in the autosampler is displayed perform step 4 Otherwise perform step 5 This window is displayed in the following cases When the operation to verify the analysis conditions was performed for the first time after the start of the inst...

Page 269: ...an incorrect cuvette is placed NOTE If OK is clicked with an incorrect cuvette placed or with the nozzle or the sample inlet improperly positioned the nozzle will come down and the nozzle tip will be bent Make sure to check that the cuvette is the correct one and the nozzle and sample inlet are properly positioned Fig 3 33 Dialog Box for Checking the Nozzle Position 5 Check that the nozzle is posi...

Page 270: ...ification of Measurement Condition 3 46 Fig 3 34 Dialog Box for Checking the Nozzle Position 6 Once the analytical conditions are verified display changes to the Monitor window Fig 3 35 Fig 3 35 Monitor Window ...

Page 271: ...n a graph a menu will be displayed to allow scale change and other manipulations Fig 3 36 Configuration of Monitor Window 1 Monitor Graph Absorbance signal can be monitored in real time Normally the background correction signal is indicated in red and the background absorption reference signal in blue Absorbance data of the latest measured sample is indicated at the top of the window Clicking the ...

Page 272: ...r selection of Table of Each Element the value mean value for each sample ID is indicated Under selection of Detail Table the repetitive measurement data for the specified sample ID is indicated In the latter case the sample ID needs to be specified after clicking the down arrow at the right of Sample ID To specify the sample ID to check click the down arrow on the right side of the sample ID Also...

Page 273: ... indicated here only after input PMT Voltage The present voltage applied to the photomultiplier is read here A lower photomultiplier voltage indicates a higher light intensity so this voltage is useful as a reference for judging a change in lamp energy or a wavelength deviation If the PMT voltage increases check the line spectrum of the hollow cathode lamp Click Display Line Spectrum in the Check ...

Page 274: ...k the Instrument Log in the Tools menu the Instrument Log dialog box will appear Select the Cuvette Type for use in the Cuvette Firings column and click Set button then the Firings setting dialog box will appear Fig 3 37 Instrument Log dialog box NOTE Set all the Firings of each cuvette kind The Firings is not counted when displayed in the Start Date as ...

Page 275: ...rting the calculation set Running Time to 0 0 Fig 3 38 Dialog box for Setting the Running Time Number of cuvette firings The number of firings of each cuvette is counted Select a cuvette to set the number of firings for Click Set to open Firings Setting Fig 3 39 Enter the number of firings in the Firings field and click Set Fig 3 39 Firings setting dialog box NOTE When newly using the cuvette clic...

Page 276: ...ialog Box for Setting the HLamp Running Time NOTE If a new lamp is used click Set with the Running time being 0 0 Cuvette Heating Temperature Indicates the cuvette heating temperature The temperature of 0 C means that heating current is not flowing Pressure Monitor Represent cooling water flow argon Ar and alternate gas Alt pressure monitors respectively If water or gas is inadequate the correspon...

Page 277: ...Conditions button on the toolbar to open the Set Conditions dialog box Fig 3 41 Set Conditions Dialog Box 2 Check that the element to be measured first has been selected indicated in blue then click OK button Check that the Lamp No matches the number of the socket of the hollow cathode lamp Check that the lamp surface is free of dust and dirt 3 In the status field of instrument monitor bar Set Con...

Page 278: ...at the center of the displayed spectral graph and then click the OK button Line spectra obtained in Next Data or Previous Data can be checked The displayed line spectrum can be printed with the printer by clicking Print Fig 3 42 Lamp Spectrum Dialog Box CAUTION Beware of Intense Light The hollow cathode lamp emits intense ultraviolet rays Directly gazing at the lamp could therefore result in impai...

Page 279: ...lution when the nozzle tip is rinsed only once each time Note that the minimum volume of this solution is about 300 mL For purging air bubbles formed in the sample tube during replacement of rinse water it should be flowed in advance Flow the solution by clicking the Rinse Nozzle button on the toolbar Repeat this operation twice or more NOTE This operation cannot be selected unless Verify is perfo...

Page 280: ...e tip is right above the sample injection hole of the cuvette If the nozzle tip is not aligned with the injection hole the following procedure should be implemented a Adjust the front rear direction of nozzle by turning the nozzle position front rear direction adjustment knob b Adjust the left right direction by turning the nozzle position left right direction adjustment knob 4 Adjust the vertical...

Page 281: ...zzle Adjustment Knob for front rear direction Knob for left right direction Knob for vertical direction Nozzle about 0 0 5 mm Cuvette with one sample inlet Cuvette with two sample inlets DHR cuvette about 0 0 5 mm Cuvette cross section Cuvette cross section Nozzle ...

Page 282: ... the previous position If Move Nozzle is clicked the nozzle may not enter the sample inlet and may be damaged Prepare standard samples and unknown samples and set them on the sample tray according to the sample map in the Autosampler display of Method window Sample cups can be set in Nos 1 to 60 The cups are numbered 1 to 10 from bottom left to right and numbered 11 to 20 on one level up The top r...

Page 283: ...o the number of measurements and addition volume or dilution volume for dilution and prepare with some excess volume taking the minimum sample volume of container into account 3 A highly viscous samples may not be measurable with the autosampler NOTE On Influence of Sample Vapor If a sample is left on the autosampler the sample vapor may affect the instrument Especially a sample containing hydrofl...

Page 284: ...asuring an organic solvent sample a solvent capable of dissolving the sample is necessary for rinsing Use of the same solvent as the sample is desirable Use combination with another solvent if necessary 3 In measurement of an organic solvent flow cut performance of the nozzle tip is much poorer than with aqueous solution Therefore reproducibility may be degraded 4 In measurement of an organic solv...

Page 285: ...e Line NOTES 1 A water flow of about 2 L min is required within a water pressure range from 35 to 50 kPa about 0 35 to 0 5 kgf cm 2 If the temperature of cooling water is much lower than the room temperature condensation of water vapor in the air may occur on the quartz window of atomizer resulting in degradation of the components and defective data Water temperature should be limited within 5 C o...

Page 286: ...the OK button Set the heating time to 5 to 20 s 5 to 10 s for Pyro Tube C HR and Pyro Tube D HR A heating time of 5 to 10 seconds is usually adequate for any graphite cuvettes Fig 3 46 Maximum Heating Dialog Box 3 Maximum heating of the graphite cuvette 2800 C 3000 C for Pyro Tube C HR and PyroTube D HR starts and Maximum Heating is displayed on the status field 4 On completion of maximum heating ...

Page 287: ...f this is the case click Calibrate GA Optical Temperature Control in the Instrument Control menu to memorize the relational expression In atomization under the optical temperature control once the equation is memorized atomization temperature is always kept at a constant level emission intensity despite a change in cuvette resistance Since the relationship has been memorized before shipment from t...

Page 288: ...nger of ignition and resulting burns due to residual moisture If moisture remains in the graphite furnace after cleaning the interior the moisture may be decomposed and produce a hydrogen flame when heating the unit So if water is spilled or cooling water leaks be sure to wipe it up thoroughly If the cover of the graphite furnace is left open when heating there is a danger of ignition resulting in...

Page 289: ... Ready appears on the status area The status of the measurement will be displayed Fig 3 48 The process in progress ashing in the figure and then its elapsed time 0 s in the figure are displayed behind the In Progress and the set time of the process 20 s in the figure is displayed behind Fig 3 48 Status Display The top of the Sample ID Sample Name is Sample ID which consists of measurement order el...

Page 290: ...on Note that when clicking the Close Sequence button display changes to the Data Process window in which the data measured so far is indicated Therefore the data can be saved here 2 When clicking the Stop button in the tool box during measurement it stops immediately irrespective of sample heating status Fig 3 51 Stop Button Then clicking the Start button resumes measurement of the relevant sample...

Page 291: ... remains in the graphite cuvette Otherwise the sample will scatter and contaminate the inside and vicinity of the cuvette 3 10 Change of Monitor Graph Display Each of monitor graph profile graph and working curve graph allows an independent change of its scale and the readout of cursor specified data with the trace cursor displayed For the above purpose first bring the mouse cursor onto the target...

Page 292: ...ton on the toolbar Though the items appearing in the displayed dialog box will vary according to the graph selected basically the following items can be set 1 Display Mode monitor graph only Measuring Signal is displayed only during measurement In manual measurement the signal is displayed from the clicking of Start button until the end of measurement And when using an autosampler the signal is di...

Page 293: ...set at scale and the enlarged reduced display of graph Max Min Displays scales only for the maximum and minimum set at scale Scale divisions at two locations one each at the top and bottom Max Mid Min Displays scales only for the maximum and minimum set at scale plus the central value between them Scale divisions at three locations one each at the top middle and bottom 4 X axis Scale By putting a ...

Page 294: ...e maximum and minimum set at scale plus the central value between them Scale divisions at three locations one each at the top middle and bottom By clicking the auto scale button on the toolbar in the case of a profile graph or working curve graph auto scaling will be executed for both vertical and horizontal axes Auto scaling is executed only for the vertical axis The display is optimized The chan...

Page 295: ... measurement This can be done by clicking Overlay A profile is overlaid upon completion of each measurement The number of data points to be overlaid can be specified using No of Overlays The number of overlays can be set to a value from 1 to 100 This can be done by clicking The scale is automatically determined according to the signal strength Refer to 3 10 Changing the Display of a Monitor Graph ...

Page 296: ...xis Auto Scale Refer to 3 10 4 Y axis Auto Scale Reset Scale Refer to 3 10 5 Reset Scale Print Graph Refer to 3 10 6 Print Graph Copy Graph Refer to 3 10 7 Copy Graph 3 14 Termination of Measurement When all of the set unknown sample measurements are finished the display changes to the Data Process window and the results of measurements are displayed If autosave is enabled for analysis results the...

Page 297: ...re check that the Eco mode is off If the mode is on turn it off In the Eco state the software cannot be exited Refer to 5 16 Power Water Saving by Eco Mode Fig 3 56 Cooling Water Eco State To disable the Eco state click Disable Eco State in the toolbar on the data collection monitor screen Fig 3 57 Disable Eco State Button ...

Page 298: ...lity NOTES 1 In the Eco state the atomic absorption spectrophotometer software cannot be exited Make sure to disable the Eco state before exiting the software 2 The water save mode is available only for the tandem type ZA3000 3 When the water circulator is used for cooling water it may cause breakdown of the water circulator Do not use the water saving mode function ...

Page 299: ...ble Profile Graph Working Curve Graph and Instrument Monitor Bar commonly used with Monitor window As for Data Table Profile Graph and Working Curve Graph display area can be changed in size by dragging the boundary line with the mouse Fig 4 1 Data Process Window In the Data Process window the date of measurement 1 in Fig 4 1 is displayed and at the date and time of measurement end a temporary fil...

Page 300: ...at closure of a sequence the result of the relevant measurement is displayed However if a new measurement is carried out or a result file is opened subsequently the target data may not be displayed at the foremost position In such a case click the Window menu Among the displayed file names click the desired one to display the data Fig 4 2 Selection of Result File ...

Page 301: ...ple ID Codes The asterisk represents a number Sample ID Type of Sample BLANK Blank solution STD Standard sample STD R Reslope sample STD C Standard check sample QCS QC check sample UNK Unknown sample UNK A Spike added unknown sample UNK D Diluted unknown sample UNK W Unknown sample diluted twice UNK DA Diluted unknown sample with addition of spike 1 Table of Each Element An analytical table of all...

Page 302: ...isted below Indication Cause Remedy E Light intensity is 120 or higher In manual measurement execute auto zero If lamp warm up is not adequate in the autosampler mode this mark may be attached to data for some time after start of measurement In this case remeasurement is required If this mark still appears despite warm up for 10 to 15 minutes or longer deterioration or abnormal discharge of the la...

Page 303: ...eduction of atomizing temperature or current control of atomization F Concentration could not be determined The working curve is not a continuously increasing function two concentration values correspond to one absorbance value Make sure the order of standard samples is correct and the concentrations are appropriate Then carry out measurement again O The concentration exceeds the allowable numeric...

Page 304: ... row highlighted in blue selected in Data Table is overlaid And when clicking the all profile overlay button all measured data is overlaid For specifying other measured data in the 1 sample display of Table of Each Element or Concentration Table double click the target row For displaying only one data in repetitive measurement specify 1 data by the profile overlaying function in 4 5 9 Clicking the...

Page 305: ...ect data to be displayed on the window 1 Click Overlay See Fig 4 5 Fig 4 5 Dialog Box for Specifying Overlaying Profile 1 2 Select in the Sample ID field a sample to be overlaid You can select randomly by clicking sample IDs while holding Ctrl on the keyboard ...

Page 306: ...Box for Specifying Overlaying Profile 3 4 Click OK You can select a sample ID from the Selected Data field and click Remove to move it back to the Sample ID field Overlaying all profiles Display atomized profiles of all measurement samples in a measurement data file Printing Print out atomized profiles Copying Save the atomized profile window to the clipboard ...

Page 307: ...ouse cursor around the line The cursor status changes to a moving cursor Click the mouse under this status and move it up and down to determine a new baseline position Fig 4 9 Profile Dialog Box 3 Click Set Baseline Fig 4 9 2 You can return to the original baseline position by clicking Reset Fig 4 9 3 Processing time You can configure and recalculate the range period of atomized data 1 2 3 1 ...

Page 308: ...log Box 3 Starting time configuration line is displayed Fig 4 11 1 Place your mouse cursor around the line The cursor status changes to a moving cursor Click the mouse under this status and move it right and left to determine a new starting time position for atomized data Fig 4 11 Profile Dialog Box 4 Click Set Start Time Fig 4 11 2 5 Also set Set Completed Time 1 1 3 4 2 ...

Page 309: ...ng time range of period for atomized data click Recalculate Fig 4 11 3 The selected data are recalculated You can return data to the original position by selecting the data by Overlay or Overlay All Profiles and then clicking Reset Fig 4 11 4 ...

Page 310: ...have been measured a list of working curves can be displayed by clicking the Working Curve Preview button Then double click each graph and the details of the relevant working curve will be displayed Clicking the Trace button displays the trace cursor on a graph and concentration and absorbance values are indicated at the top You can read the values at the cursor position while dragging the trace c...

Page 311: ...btained from the working curve data However no calculated value becomes available when the number of repeated STD measurements is only once Fig 4 13 Working Curve Detail Dialog Box 1 Changing the Order of Working Curve The order of working curve is changeable by clicking the down arrow in the Order input field at the bottom right of this window After change clicking of the Recalculate button is re...

Page 312: ...utton The data subjected to zero shift can be reset to the original status by setting the OFF status and clicking the Recalculate button 5 Weighting Depending on the range of the working curve the results of measuring low concentration may be affected by the absorption level of the highly concentrated standard solution To reduce such impact you can use a working curve calculation formula suitable ...

Page 313: ...ration The value of concentration can be changed When changing it click the value of Conc and please input directly Click Recalculate for the update 7 Copying the Working Curve When clicking the Copy button the working curve graph can be copied into the clipboard The graph can be used as an image file 8 Printout of Working Curve Click the Print button and the working curve graph will be printed Us...

Page 314: ...nt result can be saved as a file into the hard disk and other recording media 1 Click Save As in the File menu and a dialog box will open For saving the data for the first time after measurement the same dialog box can be displayed by clicking the Save Data File menu or the Save button on the toolbar Fig 4 14 Save As Dialog Box 2 By default Save in is set to Desktop My Document ZeemanAAS Data If s...

Page 315: ...r easier identification 4 Click the Save button When a file of the same name already exists a dialog box for confirming overwriting on the file is displayed Check the file name and then click the Yes or No button NOTE If you attempt to terminate the atomic absorption spectrophotometer application or close the Data Process window a dialog box appears to check whether you want the results saved When...

Page 316: ...rint the file name on the upper right side header of the printed result Printing the file name helps you sort out results printed in multiple pages Check the Data file name in the Header in Fig 4 15 1 Click Report Format in the Data menu or click the Report Format button on the toolbar and the Report Format dialog box will appear Fig 4 15 Report Format Dialog Box 2 Click the Normal Form radio butt...

Page 317: ...Edit menu of the upper Menu Bar after closing the Report dialog box NOTES 1 When turning on the Graph check box in Profile the Auto Scale check box in Profile can be selected If the Auto Scale check box is removed ABS and REF range can be set up Input range 4 0000 to 4 0000 2 When turning on the Data check box in Profile all the absorbance data acquired by computer every 0 02 second will be output...

Page 318: ...isplayed Other pages can be viewed by the Next Page and Prev Page buttons displayed under the toolbar Utilize the Two Page simultaneous display of 2 pages Zoom In and Zoom Out buttons when required 9 When the contents of printout are appropriate click the Print button 10 Upon clicking the Print button the Print dialog box will open In most cases simply click the OK button When multiple printers ar...

Page 319: ...le is detailed below printing formats such as Method are the same among the tables 1 Printout with a Table of Each Element Displayed For each element the profiles due to repetitive measurement are overlaid in a single graph As numeric data only the mean values in repetitive measurement are indicated Fig 4 16 Profile Graph Printed from Table of Each Element under Display 4 4 3 Printing Format of Pr...

Page 320: ...epetitive measurement are put in order from the top For the numeric data the data due to each measurement cycle is printed When Output ABS statistic value in the Save data file field as described in Fig 4 15 of 4 4 2 Printout of Result is marked statistic values are also printed Fig 4 17 Profile Graph Printed from Detail Table ...

Page 321: ... Printout with a Concentration Table Displayed Profiles are not printed Only the mean concentration value of each unknown sample is listed Fig 4 18 Unknown Sample Data Printed from Concentration Table under Display ...

Page 322: ...e deleted In a Detail Table only the selected data of the ones resulting from repetitive measurement will be deleted 2 Click the Delete Data button at the right of a data table or click Delete Data in the Data menu 3 A dialog box for confirmation appears When deletion does not pose any problem simply click the Recalculate button 4 The deleted data is dimmed in the Data Table 5 To restore the delet...

Page 323: ...le or select the Concentration Correction command from the Data menu The dialog box will then appear In this dialog box change the concentration correction factor as desired and click the Recalculate button See Changing Sample Name as you cannot change the sample name in this procedure Click the Sample Name button at the right of a data table or click Sample Name in the Data menu A dialog box open...

Page 324: ...a menu Upon double clicking in the profile graph area or clicking Profile in the Data menu the profile dialog box is displayed to allow overlaying of profiles a single profile also allowed tracing and baseline specification For tracing left click on the Profile window to display the pop up menu See 3 12 Changing the Display of a Profile Graph for information on the usage The concentration componen...

Page 325: ...mple UNK 001S but the analytical values of that sample remain unchanged For the samples after the sample blank analytical values after subtracting those of the sample blank will be indicated NOTE STD sample cannot be specified as a sample blank 4 For canceling the sample blank specification select the row of the corresponding sample and click Sample Blank Cancel Sample Blank in the Data menu 5 A d...

Page 326: ...ing your selections No file is available at this point as a file name to be generated is configured 5 Click the Output button at the bottom of the Report Format window and the file will be output to the specified location Confirm the folder and files configured in 4 Data can be output to Microsoft Excel in the same image as on a printer and output items can be rearranged freely However use of this...

Page 327: ...adio button by clicking turn on the buttons at the right of Template and Output File and specify the template copied above and the file at the destination of output 3 When selecting Data Output in the Output area only file output is effective When selecting Automatic Output printing starts simultaneously with file output 4 The file can be output to the specified location by clicking the Output but...

Page 328: ... graph and Variable beginning with The item list sheet displays a list of items The B to M columns 12 columns stand for the 12 elements settable in Analytical Condition 2 An actual output window is classified into another sheet depending on measurement mode and display in the data table Open the target sheet and you can change layout freely by deleting or moving Character string and Variable Sheet...

Page 329: ...nual Each Element EM_MANUAL_ELEMENT Detail Table EM_MANUAL_DETAIL Conc Table EM_MANUAL_CONC Header HEADER Instrument Setup INSTERCOND Analytical Condition Graphite Furnace ANALCOND_GA Flame ANALCOND_FL Temperature Program TEMP_PROG Standards Table WORKING_CURVE_TBL Autosampler Graphite Furnace ASCOND_GA Flame ASCOND_SSC110 Preparation Autosampler ASCOND_SSC400 Dil Factor UNK Preparation Autosample...

Page 330: ...f Toxic Gas Inhalation of toxic gas could be injurious to human health Inhaling the vapor emitted from the sample may cause inflammation of the respiratory tract Be sure to operate the ventilating fan to discharge the vapor emitted from the sample through the exhaust duct WARNING Beware of High Voltage There is a danger of electric shock due to high voltage of about 400 V Touching the socket of th...

Page 331: ...anger of ignition resulting in burns Be sure to close the cover of the unit when heating and performing measurement CAUTION Do Not Touch Hot Parts There is a danger of burns upon touching heated parts The graphite atomizer is at a very high temperature Before replacing the cuvette or ring wait until the cover of the graphite furnace and the cuvette etc cool down CAUTION Beware of Intense Light An ...

Page 332: ...asured without creating a working curve This method is employed for optimization of analytical conditions and other purposes 1 Using the Method window enter necessary parameters in Measurement Mode Elements Instrument Setup and Analytical Condition For details refer to Section 3 2 Click the Standards Table button to open the Standards Table window Fig 5 1 Fig 5 1 Standards Table Window 3 In the De...

Page 333: ...sample is determined and extrapolation is performed on the assumption that the linear relation is held through the concentration range to 0 Develop a working curve by adding to a certain amount of unknown samples a standard solution of a desired element after modifying the concentration This working curve is affected by co existing substances included in the unknown samples Fig 5 2 Fig 5 2 Working...

Page 334: ...nadequate due to a reason such as high sample viscosity 5 1 3 Standard Addition Method ex furnace addition should be used 1 Starting from the Method window make entries in the Measurement Mode window Elements window Instrument Setup window and Analytical Condition window For these entries refer to Section 3 2 Click the Standards Table button to display the Standards Table window Fig 5 3 Fig 5 3 St...

Page 335: ... nor convex In addition STD1 concentration is required to be 0 5 Make entries for UNK Decimal Place and UNK Unit UNK Replicate in the standard addition method is fixed to 1 once Entry of another value will be neglected 6 Make entries in the Sample Table window Fig 5 4 Sample Table Window 7 In the Sample Injection window in Autosampler enter a value for Injection Volume To the sample injection volu...

Page 336: ...y problem Blank hereby indicates a blank sample for determining the extrapolation value of working curve Prepare what resembles humoral of unknown samples for example the diluents of the unknown samples Or use purified water if the former is unavailable 9 Verify the conditions place standard samples unknown samples and blank samples in the sample rack and then start measurement 1 ...

Page 337: ... of an element to be measured after changing the concentration Then mix the entire liquid samples with pure water etc You can create working curves by taking into consideration the co existing substances as the STD includes the equal amount of the unknown samples In the ex furnace addition method standard added samples are to be prepared manually and set in the autosampler for implementing the sta...

Page 338: ...d in Order select Linear 4 In the Working Curve field make entries for No of STDs STD Replicate STD Decimal Place STD Unit and STD Conc In the standard addition method concentration is calculated by extrapolation of a linear working curve Therefore STD concentration should be set within a range where working curve is neither concave nor convex In addition STD1 concentration is required to be 0 5 M...

Page 339: ...tandard addition method only the first sample will be measured Although no sample will be aspirated actually at the cup position specified for an unknown sample input is required for displaying the sample name Fig 5 8 Sample Table Window 7 In the Sample Injection window in Autosampler enter a value for Injection Volume Usually a volume of about 20 L is appropriate ...

Page 340: ...enter the cup No of the unknown sample to which each standard sample was added 9 Verify the conditions place standard added unknown samples and blank sample in the sample tray and then start measurement At the position specified for an unknown sample cup No no sample needs to be set as the entire amount of the mixed samples prepared by using flasks have already been set in the autosampler 1 ...

Page 341: ...lly If mixing of unknown and standard samples in the furnace is inadequate due to a reason such as high sample viscosity the ex furnace addition method should be used 1 Starting from the Method window make entries in the Measurement Mode window Elements window Instrument Setup window and Analytical Condition window For these entries refer to Section 3 2 Click the Standards Table button to display ...

Page 342: ...method concentration is calculated by extrapolation of a linear working curve Therefore STD concentration should be set within a range where working curve is neither concave nor convex In addition STD1 concentration is required to be 0 5 Make entries for UNK replicate UNK Decimal Place and UNK Unit Note that UNK Replicate is applied to the second sample onward The first sample will be measured wit...

Page 343: ...osition specified for the first UNK sample but the sample names need to be entered to display the sample names Fig 5 12 Sample Table Window 7 In the Sample Injection window in Autosampler enter a value for Injection Volume To the sample injection volume set here the standard sample of the same volume will be added So far as an adequate sensitivity is ensured a volume of about 10 L is appropriate ...

Page 344: ...trapolation value of working curve Use the unknown sample diluent or purified water if the former is unavailable 9 Verify the method place standard samples unknown samples and blank sample in the sample tray and then start measurement NOTE For the first unknown sample select the one that contains a matrix constituent co existing substances having the average composition of all unknown samples and ...

Page 345: ...y taking into consideration the co existing substances as the STD includes the equal amount of the unknown samples This method is effective for measuring a number of samples similar in matrix composition In the ex furnace addition method standard added samples are to be prepared manually and set in the autosampler for implementing the standard addition method If mixing of unknown and standard samp...

Page 346: ...In the Working Curve field make entries for No of STDs STD Replicate STD Decimal Place STD Unit and STD Conc In the standard addition method concentration is calculated by extrapolation of a linear working curve Therefore STD concentration should be set within a range where working curve is neither concave nor convex In addition STD1 concentration is required to be 0 5 Make entries for UNK replica...

Page 347: ...f samples including the first unknown sample Although no sample will be aspirated actually at the cup position specified for the first unknown sample input is required for displaying the sample name Fig 5 16 Sample Table Window 7 In the Sample Injection window in Autosampler enter a value for Injection Volume ...

Page 348: ...ndard added unknown samples namely second and subsequent unknown samples and blank sample in the sample tray and then start measurement No sample needs to be set in the cup No specified for the first unknown sample as the entire amount of the mixed samples prepared by using flasks have already been set in the autosampler NOTE For the first unknown sample select the one that contains a matrix const...

Page 349: ... Standard Solution Concentration and Injection Volume of Actual Standard Solution Injection Volume of Diluent STD 1 0 g L 0 g L 20 L STD 2 25 g L 100 g L 5 L 15 L STD 3 50 g L 100 g L 10 L 10 L STD 4 75 g L 100 g L 15 L 5 L STD 5 100 g L 100 g L 20 L 1 Starting from the Method window make entries in the Measurement Mode Elements Instrument Setup Analytical Condition Standards Table and Sample Tabl...

Page 350: ...ution Aliquots Preparation NOTES 1 The concentration of Stock STD should be higher than that of standard solution 2 Accuracy of injection volume will become poor if you employ such a standard sample preparation that would reduce pipetting volume below 5 L 3 Determine the value of the concentration of the standard solution Aliquots in a way the injection volume can be divided by the sample volume i...

Page 351: ...oy Pd Ni platinum metal phosphorus compound Acid Nitric acid KMnO4 K2S2O8 Reduction Ascorbic acid iodine Chelation EDTA Organic acid Tannic acid citric acid ascorbic acid Preventing carbide generation Ca Mo Removing interference Removing chloride Hydrofluoric acid nitric acid ammonium salt 1 In the Autosampler window Fig 5 19 open the Modifier QC Cup No and specify Modifier Modifier cup Nos M1 M2 ...

Page 352: ...n the cuvette after injection It is recommended to select Post for better effectiveness on constituents in the samples or Pre for suppressing interaction between the cuvette surface and the samples NOTE Total volume of injection into a graphite cuvette is given by the sum of total addition volume of modifiers 1 to 4 Injection Vol set in analytical condition setup This volume should not exceed the ...

Page 353: ...rs compared with the measurement with no sequential injection You can also expect the similar effect by reducing the concentration 1 Click Autosampler button on the Analytical Conditions Setting window to display the Autosampler window 2 Double click Inject sampler tab to display the Sample Injection window 3 Set the Sequential injection to Yes in the sequential injection field on the window Mark ...

Page 354: ... The sequential injection is not recommended for measurement in the order of multiple μg L ppb measurement of elements susceptible to contamination such as Na and Zn etc measurement of samples with highly concentrated elements and measurement of anything with large contamination factors 2 The cleaning of the nozzle s outer wall is not designed to completely remove contamination ...

Page 355: ...od improves the heat conductive efficiency You can expect improved absorption sensitivity in measuring high melting point elements such as Mo and V etc 1 Set up a Pyrotube D HR and set the cuvette type on Analytical condition window to Pyrotube D HR Fig 5 21 Fig 5 21 Setting Pyrotube D HR 2 Set a sample volume to be injected on the Autosampler window Inject half the volume configured into each por...

Page 356: ...perly positioned and click OK in the dialog box Fig 5 23 Click Cancel if the cover of the graphite furnace is not opened or a different cuvette is installed NOTE Be sure to make the above checks as clicking OK while a different cuvette is installed or the nozzle and cuvette inlet left are not properly positioned causes the tip of the nozzle to bend when the nozzle goes down Fig 5 23 Dialog Box for...

Page 357: ...5 5 Twin Injection 5 28 Fig 5 24 Dialog Box for Confirming Nozzle Position 7 Click Start measurement ...

Page 358: ... method Heating method 1 Open Autosampler window and mark the Cuvette Cleaning Fig 5 25 Setting Cleaning Cuvette Window 2 Click Heating radio button Set the heating time 1 10 seconds and the cooling time 10 20 seconds 3 Set the number of cuvette cleanings 1 3 Determine the number of cleanings between sample measurements NOTE The maximum heat method is designed only for baking Use the temperature p...

Page 359: ...erature Program radio button on Analytic conditions window Fig 5 26 Setting Analytic Conditions Window Fig 5 27 Setting Temperature Program for Cleaning Window 2 Enter the temperature program for cleaning Fig 5 27 You can set the temperature program for each element ...

Page 360: ... Cleaning Fig 5 28 Setting Cleaning Cuvette Window 4 Click the Temperature Program radio button Set the cleaning injection volume and the cleaning cup No 5 Set the number of cuvette cleanings 1 3 Determine the number of cleanings between sample measurements ...

Page 361: ...le See Fig 5 29 Fig 5 29 Setting Sample Bumping Detection Window NOTE This detection is designed to assign with P when the values of the sample signal and the reference signal exceed a certain value against the noise of each signal If detected you can assume that the heating temperature or the temperature gradient in the drying stage is high relative to the sample measured Possible corrective acti...

Page 362: ...s significant the correction error will expand In this case the entire working curve should be generated newly by using the QC function Correction of the working curve by the reslope function is carried out as follows when STD4 is specified for STD for Reslope and correction for every 10 samples 1 Creation of Working Curve Working curve A Absorbance C Concentration a Coefficient n Order of working...

Page 363: ...etting is required as follows a Open the Standards Table window and turn on the Reslope check box b In STD for Reslope enter the name of standard sample used for correction c In Reslope Interval enter the sample interval for correction Supplement Resloping in manual measurement Usually reslope measurement is carried out at the set sample interval Also this measurement can be started freely by clic...

Page 364: ...ction and drying multiple times For concentrating a sample make your entry for Conc Times in the Sample injection tab display of Autosampler window Fig 5 32 The input range is 1 25 Both standard and unknown samples are to be concentrated Fig 5 32 Setting for Concentrating Sample NOTES 1 The measurement time increases as the number of concentrations increases 2 Reproducibility may deteriorate compa...

Page 365: ...ncentration in the unknown sample is high Setting is required in the following procedure 1 Open the Sample Injection tab in the Autosampler window Fig 5 33 2 In the Sample Dilution table click the Dil Factor Fig 5 33 1 of each sample and enter a desired factor According to the set Injection Volume and Dil Factor Volume is automatically calculated and indicated When Volume is 5 L or less pipetting ...

Page 366: ...et Dil Factor to All Samples Fig 5 33 2 button 4 Place the diluents in the cup No set in the Dilution Cup No Fig 5 33 3 and start measurement NOTE Among the Data Tables in the Data Process window the Table of Each Element and the Concentration Table list values after correction for dilution factor in Conc while the Detail Table lists values before correction in Conc and those after correction in C...

Page 367: ...er window 2 Set Yes for Heat Injection and enter a desired cuvette temperature for Heat Temp 3 Enter a desired sample injection speed for Injection Speed at the bottom left of this window The relationship between the specified number of injection speed and the actual injection speed is listed in the table below Specification No Aspiration Injection Speed L s 1 2 2 6 3 19 4 30 5 60 NOTE Set an appr...

Page 368: ...ton on the toolbar Fig 5 34 Copy Method Button In case the instrument is now in the stop status due to clicking of the Stop or Pause button during measurement you should click the Close Sequence button Then the Data Process window will appear 2 In response to the confirmation message click the Yes button 3 Display changes to the Method window Change conditions such as the number of unknown samples...

Page 369: ...mizing the influence by sensitivity variations such as use of the data just after measurement or combined use of the reslope function 1 For using the data just after measurement copy the analytical method referring to 5 7 2 For using the working curve in the saved data open the saved measurement result in the Data Process window and click the Copy Method button Reference 2 3 4 Opening a File 3 In ...

Page 370: ...e analyte element is double clicked the Working Curve Detail dialog box will open In this dialog box check the conditions of the working curve concerned 6 Click the Verify button and start measurement NOTE The sensitivity of the furnace atomic absorption spectrometry varies depending on the status of the instrument Use measurement results as latest as possible for the existing working curves ...

Page 371: ...g samples in the cuvette through the maximum heat by removing the autosampler tray 1 With the current measurement kept in pause click the Edit Sample Table button in the Monitor window Fig 5 37 Edit Sample Table Button 2 The Edit Sample Table window opens Then click the Sample Name Conc Correct tab A sample after measurement is indicated in blue characters and a sample before measurement is indica...

Page 372: ...nge the IDs so that the inserted UNK sample ID does not duplicate with the existing UNK sample ID 2 Even if a sample is added above the row of an already measured sample it will not be measured 3 For adding a sample on the last row click a blank area in the table or an item such as sample name to cancel the row selection there will be no blue rows Added sample ...

Page 373: ... the ID of the inserted sample so as to avoid a double use of the same ID You cannot change the sample ID which finished measurement Change the added sample ID 4 Click the UNK Cup No tab and change the Cup No of the inserted sample so as to avoid a double use of the same Cup No Then click the OK button Fig 5 41 Inserting Unknown Samples Added sample ...

Page 374: ...our confirmation click the OK button 4 Click the Start button for measurement NOTES 1 Remeasurement cannot be performed when the QC function is set 2 After the relevant sample was remeasured measurement of the samples yet to be measured among the set ones will continue 2 Remeasurement cannot be performed when the relevant sequence was closed after all the set samples were measured 5 14 2 Remeasure...

Page 375: ... the Utilities in the Tools menu and in the Utilities window click the Startup tab Fig 5 42 Startup Settings Method File You can specify the method file which will open automatically at start of the AAS program For newly creating a method either radio button may be selected When the Open Latest Method File radio button is selected by clicking in advance the method file saved lastly will open at st...

Page 376: ...ing Tools Online from the menu bar Set Conditions at Startup When Communicate with Instrument at Startup is selected this function automatically carries out the procedure up to condition setting lamp lighting and wavelength adjustment in the set method To activate this function click the Set Conditions at Startup check box to put a check mark in it If this function is not used manual condition set...

Page 377: ...ing mode Flow of cooling water is stopped However the flow continues when the flame is on This mode is activated when no operation of the instrument is made for over 10 minutes NOTES 1 The water saving mode is available only on the Tandem model ZA3000 2 When the water circulator is used for cooling water it may cause breakdown of the water circulator Do not use the water saving mode function 1 Ope...

Page 378: ...back online with the PC NOTE The Eco mode function starts to run after getting back online The power saving mode indicates the lamp mark and auto lamp mark in green on the Instrument Status window Fig 5 45 Eco Status Power Saving Mode The water saving mode indicates the cooling water mark in green on the Instrument Status window 5 16 2 Canceling Eco Status ...

Page 379: ...5 47 Eco Status Cancellation Button You can also cancel the Eco status in the following procedure Click Canceling the Economy Mode in Instrument control of the toolbar Fig 5 48 Running Utility NOTE Be sure to cancel the Eco status as the software cannot be operated or the furnace atomic absorption spectrometry software cannot be terminated under the Eco status ...

Page 380: ...file name and click the Save button Now the temporary data is saved formally under the selected file name 3 Open the Data Process window In the File menu click the Open Data File open the file saved in 2 and check the contents NOTES 1 Following a power recovery and after the restart of the AAS program the restoration of the backup file must happen before verification of any analytical conditions O...

Page 381: ...nt judges whether or not the analytical result is appropriate According to the judgment you can remeasure the same sample as required Operating procedure and details of this function are explained below 1 Display the QC window by clicking the QC button Fig 6 1 1 in the Method window Fig 6 1 QC Window 1 ...

Page 382: ...greement with the message in QC measurement Change of working curve order change of STD concentration deletion of sample restore of sample exchange of samples calculation mode sample blank zero point shift of working curve baseline shift However if only Check Working Curve is desired deletion restore exchange of unknown samples and sample blank are allowed 3 For using the QC function the Dil Facto...

Page 383: ...Mode Del Outer STD cannot be specified in Action 2 Set the following items Corr Determ Coef Specify the reference value of correction coefficient for checking if the working curve is appropriate In case the order of working curve is linear correction coefficient is used for judgment In case the order is quadratic or cubic determination factor is used Action Specify any of the processes below in ca...

Page 384: ... curve is still smaller than the reference value measurement will be terminated When an element to be measured next is set however it will be measured The following messages are printed in the report Correlation coefficient is out of range Measurement is finished Delete a standard sample which deviates most from the working curve and create a working curve again STD is deleted represents an STD nu...

Page 385: ...will be measured again 1 Click the check box of Check Sample Fig 6 3 Check Working Curve Window 2 Set the following items Tolerance Stands for an allowable percent value above the upper limit concentration of working curve maximum concentration of standard sample If the concentration of an unknown sample exceeds this tolerance it will be diluted and remeasured In case the maximum concentration of ...

Page 386: ...n for which a working curve is created An error message is displayed for a dilution factor below the minimum sample volume AbsMax 0 1 AbsSample 1 5AbsMax Diluted by 2 fold 1 5AbsMax AbsSample 2AbsMax Diluted by 5 fold 2AbsMax AbsSample Diluted by 10 fold AbsMax 0 1 AbsSample 1 5AbsMax Diluted by 2 fold 1 5AbsMax AbsSample 3AbsMax Diluted by 5 fold 3AbsMax AbsSample Diluted by 10 fold Direct Specif...

Page 387: ...surement was outside the permissible range again the next sample measurement will be carried out 2 When the determination mode is set to Simple STD Add the first unknown sample will be excluded from the RSD limit check The following messages are printed on the report according to the settings Measured concentration exceeds the useful range of the working curve Dilute the sample and measure again C...

Page 388: ...tration value calculated by fitting the measured absorbance of standard sample to the working curve 1 Click the check box of Check STD Fig 6 4 STD Check Window NOTE When Check Working Curve is specified Check STD cannot be used In this case standard sample can be specified for Check QC Sample 2 Set the following items STD Specify the number of standard sample to be used for judgment NOTE The stand...

Page 389: ...e measurement with a message End Terminates measurement for current element When an element to be measured next is set however it will be measured Rerun All STD Remeasures all standard samples and creates working curve again Then the measurement procedure will return to an unknown sample immediately after the previous Check STD measurement NOTE If the tolerance cannot be met again after remeasruem...

Page 390: ... be performed as a failure action according to specification Other permitted actions are continuing ignore failure or ending the sequence The permissible range is judged from the following expression Two different QC samples are supported you can specify QC Sample 1 and QC Sample 2 1 Click the check box for Check QC Sample Fig 6 5 STD Check Window Measured concentration QC sample concentration QC ...

Page 391: ... an allowable deviation of the measured concentration from the input QC sample concentration NOTE When an interval value is specified in one of Check QC Sample and Check STD the value will be automatically assigned in the other checks Action Specify any of the processes below in case the measured value does not meet the tolerance Continue Continues the sequence of unknown sample measurement with a...

Page 392: ... window appearing when clicking the Sample Map tab NOTES 1 If the tolerance cannot be met again in Check QC Sample after remeasruement of working curve and unknown sample measurement will be terminated When an element to be measured next is set however it will be measured 2 If working curve is regenerated during measurement in the simple STD addition method data of the first unknown sample can be ...

Page 393: ...n measured to obtain its recovery If the recovery does not match the permissible range Recovery Tolerance the unknown sample will be diluted and measured again All unknown samples will be measured without adding a spike sample diluent added for matching the volume and with the spike sample added 1 Click the check box of Check Recovery Fig 6 7 STD Check Window 2 Set the following items Spike Vol L ...

Page 394: ...rcent value from recovery 100 Recovery is calculated by the following formula Recovery Dilution Factor In case recovery is judged to be outside Recovery Tolerance the unknown sample may be diluted and remeasured depending on specification For dilution its factor needs to be specified here Input is effective within a range from 1 5 to 10 0 times Sample Volume stands for the volume of unknown sample...

Page 395: ...will be measured Dilute Sample Dilutes the unknown sample and performs recovery check again NOTES 1 When dilution has been made in Check Sample Check Recovery is performed with the diluted unknown sample alone 2 If recovery for diluted sample does not satisfy Recovery Tolerance again sample dilution is not repeated and the next sample measurement will be performed 3 In the window appearing when cl...

Page 396: ...ages are printed in the report Recovery value exceeds the permissible range Sample will be diluted and measured again Even if it dilutes recovery value exceeds the permissible range Measurement with the STD addition method is required Spike recovery value 6 5 2 Contents to be Printed on the Report ...

Page 397: ...w and Data Process window has the QC Message button on the toolbar Fig 6 9 QC Message Button Press this button by clicking and double click each data in Data Table Then QC message corresponding to the data will be displayed Fig 6 10 Display of QC Message ...

Page 398: ...ent has not yet been completed you can start the measurement of the next element specified if more than 2 elements are specified in the measurement conditions 1 In the tool box click the Next Element button Fig 7 1 Next Element Button 2 The lamp is now changed to the one for the next analyte element The element being measured displayed on the window changes to the next element 3 Click the Start bu...

Page 399: ...ew methods or terminating the AAS program is not permitted 2 In the autosampler mode the sequence is automatically closed when measurement of the set samples is completed and display changes to the Data Process window 2 In response to the confirmation message click the Yes button Measurement result files are stored on a specified folder when the auto saving is set The measurement result finished i...

Page 400: ...ary message will appear Water pressure may be applied to the cooling line after the electromagnetic valve closes Be sure to stop the cooling water before working on the next task Fig 7 4 Dialog Box for Cooling Water 3 A message on the samplers left on the autosampler appears Be sure to get rid of any samples left on the autosampler ...

Page 401: ...ask NOTE The message does not appear on the ZA3700 series Fig 7 6 Dialog Box for Acetylene Gas 5 A message to terminate the atomic absorption spectrophotometer appears Click Yes to close Fig 7 7 Dialog Box for Terminating Software 6 If any measurement result data is not yet saved a confirmation message for saving will be displayed Select a data saving option NOTE If the No button is clicked in ans...

Page 402: ...xhaust duct line 2 Remove the hollow cathode lamps 3 Close the main valves primary and secondary of each gas 4 Discharge waste solution This completes the last procedure to be taken at the end of daily operation of the instrument NOTE Influence of sample vapor If a sample is left on the autosampler the sample vapor may affect the instrument Especially a sample containing hydrofluoric acid may dama...

Page 403: ...display of the Analytical Condition window Fig 8 1 select Manual Fig 8 1 Analytical Condition Window 2 Make entries in the Element Instrument Setup Analytical Condition Standards Table Sample Table and Report Format windows See 3 Measurement with Conditions Input for the detailed conditions setting 3 Click the Verify button ...

Page 404: ...hen Lamp Spectrum On the displayed graph make sure the peak at measuring wavelength is in the center Then click the OK button NOTE When the peak is inappropriate check if the lamp is installed properly When the line noise is serious the service life of the lamp is almost out Replace with new lamp and check the lamp again CAUTION Beware of Intense Light The hollow cathode lamp emits intense ultravi...

Page 405: ...m 35 to 50 kPa about 0 35 to 0 5 kgf cm 2 If the temperature of cooling water is much lower than the room temperature condensation of water vapor in the air may occur on the quartz window of atomizer Water temperature should be limited within 5 C of the room temperature 2 Cooling water should be supplied shortly before measurement for preventing condensation ...

Page 406: ...ever 5 10 seconds for Pylon tube C HR and Pylon tube D HR Normally 5 10 seconds are enough for any type of graphite cuvette Fig 8 3 Maximum Heating Dialog Box 3 Maximum heating of the graphite cuvette 2800 C However 3000 C for Pylon tube C HR and Pylon tube D HR starts and Maximum Heating is displayed on the status field 4 On completion of maximum heating Ready is displayed on the status field NOT...

Page 407: ...he execution In atomization under the optical temperature control once the equation is memorized atomization temperature is always kept at a constant level emission intensity despite a change in cuvette resistance Since the relationship has been memorized before shipment from the factory it needs not to be memorized frequently by user Memorization is required once in a few months or half yearly be...

Page 408: ...ger of ignition and resulting burns due to residual moisture If moisture remains in the graphite furnace after cleaning the interior the moisture may be decomposed and produce a hydrogen flame when heating the unit So if water is spilled or cooling water leaks be sure to wipe it up thoroughly If the cover of the graphite furnace is left open when heating there is a danger of ignition resulting in ...

Page 409: ...changes due to an error in the injection volume etc 3 Click the Start button in the tool box Fig 8 5 Start Button 4 The temperature program starts to carry out measurement The status area in the Instrument Monitor Bar contains the ID of a sample under measurement the current measurement stage and a time bar to indicate progress of each measurement stage 5 At completion of all measurements Ready ap...

Page 410: ...on Note that when clicking the Close Sequence button display changes to the Data Process window in which the data measured so far is indicated Therefore the data can be saved here 2 When clicking the Stop button in the tool box during measurement it stops immediately irrespective of sample heating status Fig 8 7 Stop Button Then clicking the Start button resumes measurement of the relevant sample ...

Page 411: ...ely affected To prevent this the remaining sample should be eliminated by performing a dummy measurement without injecting a sample before resuming measurement NOTE Avoid execution of Maximum Heating if a sample remains in the graphite cuvette Otherwise the sample will scatter and contaminate the inside and vicinity of the cuvette ...

Page 412: ... Element Button 2 The lamp is now changed to the one for the next analyte element and preparation for the measurement is made 3 Inject the sample and continue measurement After measuring a series of samples or while measurement is paused click the Close Sequence button in the toolbox Fig 8 9 Close Sequence Button NOTE Until the current sequence is closed it is not allowed to verify new method or t...

Page 413: ...strument is used longer however some performance items may be degraded due to deterioration of parts having a limited service life consumables or for similar reasons Therefore the performance needs to be checked Additionally certain parts require maintenance with periodic replacement or cleaning The method adopted in the instrument diagnosis function is a modified version of the inspection method ...

Page 414: ...be HR NOTES 1 Any hollow cathode lamp other than made by Hitachi High Technologies cannot be used for instrument diagnosis Use of other maker s hollow cathode lamp may result in failure to achieve exact diagnosis or a shortening of lamp life 2 If a hollow cathode lamp whose service life has already been expired is used instrument diagnosis may not be carried out correctly To avoid this be sure to ...

Page 415: ...noise drift in 5 minutes is measured to confirm that the permissible range is met 3 Sensitivity A copper Cu standard solution is measured and the measured absorbance at a specific concentration is checked to confirm it lies within the permissible range The graphite furnace mode requires use of a standard solution in 20 g L 4 Repeatability A standard solution is measured multiple times 10 times rep...

Page 416: ...The mercury and copper lamps should be set in Nos 8 and 7 respectively 2 Set the graphite cuvette Pyro Tube C 1 Click the Diagnosis button in the toolbox to display the Diagnosis window Fig 9 1 Diagnosis Button 2 Click the Measurement Mode button on the toolbar or Measurement Mode in the Method Setup menu The Measurement Mode dialog box opens In Measurement Mode select Graphite Furnace Fig 9 2 Mea...

Page 417: ...sis Conditions Dialog Box 4 In Instrument Diagnosis select Automatic or Manual In the Automatic mode measurement will be automatically carried out on the selected items In the Manual mode measurement on each item can be manually started by clicking Start each item on the Instrument Diagnosis menu When Automatic is selected you should click a diagnosis item to be executed to put a check mark in the...

Page 418: ...me period of 5 minutes 0 003 to 0 02 Abs Baseline Stability Drift Input a permissible drift value of absorbance in 5 minutes 0 002 to 0 02 Abs Sensitivity Input a permissible absorbance value in measurement of Cu 20 g L standard solution 3 repetitive measurements 0 01 to 0 1 Abs Repeatability Input a permissible relative standard deviation value in measurement of Cu 20 g L standard solution 10 rep...

Page 419: ...after completion of measurements If automatic output is not desired leave this check box off and click the OK button to close the dialog box For automatic output specify the following items Regarding Header Diagnosis Data Method and Profile click the check box of each desired item for output To turn off the check mark click it again Regarding Left Margin turn on one of the radio buttons For insert...

Page 420: ...ions Button 2 A message appears to check your intention of saving the conditions It is recommended to save the conditions here because they cannot be copied from the measured data in the instrument diagnosis mode For saving the conditions click Yes and specify the file location and name For avoiding the saving operation click No Fig 9 7 Dialog Box for Saving Instrument Diagnosis Conditions 3 In th...

Page 421: ...Fig 9 8 Start Measurement Button When Manual is selected click Start each item in the Instrument Diagnosis menu Fig 9 9 Start Instrument Diagnosis Button 3 Measurement starts 1 In the Manual mode click the Close Sequence button in the tool box Fig 9 10 End Sequence Button 9 3 4 Start of Measurement 9 3 5 Check and Saving of Diagnostic Result ...

Page 422: ...ing the result of diagnosis click the Add to Diagnosis Log button on the toolbar or Add to Diagnosis Log in the Data menu Fig 9 12 Add to Diagnosis Log Button NOTE Instrument diagnosis does not have a file saving step So save its result via Add to Diagnosis Log 4 The past records can be displayed by the Previous and Next buttons in the dialog box displayed by clicking the Diagnosis Log button on t...

Page 423: ...9 3 5 9 11 Fig 9 14 Diagnosis Log Dialog Box ...

Page 424: ...o put a check mark in it In Left Margin mark any of the three radio buttons by clicking it For insertion of page numbers click the Page No check box and mark the radio button for the desired inserting position In Output to select Printer or File Text or Excel format by marking the relevant radio button When either file is selected click the button at the right and specify the file saving location ...

Page 425: ...or the wavelength accuracy shows the status at the time of diagnosis It does not show the sensitivity or differences Check Judgment results in the table for the diagnosis results 2 The method of setting wavelength used for instrument diagnosis moves directly to the wavelength set This method is dependent on the accuracy of the wavelength drive mechanism It is not necessarily positioned at the peak...

Page 426: ...hing temperature versus absorbance will be drawn 3 Measurement can be performed while changing the atomization temperature of atomization stage at the set intervals and a graph of atomization temperature versus absorbance or atomization temperature versus absorbance reproducibility RSD will be drawn 4 In the drying and ashing stages a change of background absorbance beyond the specified value can ...

Page 427: ...ytical conditions 1 After entering necessary conditions in the Elements and Instrument Setup windows and set the UNK replicate to twice or more in the Working curve table and enter the unknown sample ID to be evaluated in the Sample table and click the Temp Program Development check box in the Analytical Condition window to put a check mark In this function multiple elements are measurable NOTE Wh...

Page 428: ...ialog Box Test Sample ID Among the unknown sample UNK IDs set in the Method Sample Table window specify the ID of the sample to be tested Input range 1 to 999 UNK Replicate The number of repetitive unknown sample measurements in test measurement is indicated here The set number of UNK measurement repetitions in the Method Standards Table window is read and no change is allowed in the Temp Program ...

Page 429: ...ed for UNK Replicate Fig 10 3 Error Message Dry Test Performs measurement while raising the start temperature of drying stage at the set intervals to display a graph of repeatability RSD at the drying temperature Start Temp The end temperature of drying is fixed at the set value Put a check mark for Dry Test by clicking its check box and perform a drying test under the set conditions Example Execu...

Page 430: ...enter a value within about 140 to 200 C Input range 50 to 1000 C Start Temp Interval C Enter a heating interval for raising the start temperature at the set intervals in the Dry Test Input range 10 to 50 C NOTES 1 If the difference between the start and end temperatures is not adequate in comparison with this interval an error will be displayed Set Start Temp Interval 20 less than End temp Start t...

Page 431: ...20 C Ramp Time s Enter a heating time when the starting temperature reaches the ending temperature in the drying stage Usually enter a value of about 40 s second Input range 10 to 100 s Gas Flow mL min Enter a carrier gas flow rate in the drying stage Usually there is no need for changing 200 mL min Input value 0 10 30 200 mL min Gas Type Select the desired kind of carrier gas in the drying stage ...

Page 432: ...t absorption is significant in the shorter wavelength region and particularly in the wavelength region shorter than 200 nm the background absorption due to the vaporization is conspicuous In the background detection function it is first judged that the background was detected upon detection of a rise in the reference signal beyond the Detection Start level set in the Temp Program Test Conditions w...

Page 433: ...lt to occur So use of this function should be avoided 2 When a platform cuvette is used the reference signal will rise significantly because the beam is substantially blocked by the injected sample so an exact judgment may be impossible Therefore the background detection function should not be used in combination with a platform cuvette 3 Background detection may fail because the reference signal ...

Page 434: ...unction should be executed after stabilization of the reference signal Detection Start Enter the REF absorbance for detection of background absorption Usually the default value should be used Input range 0 0001 to 1 0000 Abs Detection End Enter the REF absorbance at which it is judged that background absorption ended after it had been detected Usually the default value should be used Input range 0...

Page 435: ... start and end temperatures in the ashing stage are fixed at the same value Put a check mark for Ash Test by clicking its check box and an ashing test can be performed under the set conditions Example Execution of Ash Test Ash Test Conditions Start End Temp Max Temp and Interval are set at 400 C 700 C and 100 C Fig 10 8 Ashing Test Window Start Temp End Temp First measurement 400 C 400 C Second me...

Page 436: ...Test Usually enter a value of about 100 or 200 C Input range 50 to 500 C NOTES 1 If the difference between the start end temperature and maximum ashing temperature is not adequate in comparison with this interval an error will be displayed Correct your entries so that maximum ashing temperature start end temperature is larger than or equal to this interval 2 If the difference obtained by subtracti...

Page 437: ...ent to 600 C but at 700 C determined by Max Temp Dry Test is executed up to the Start Temp given by End Temp 20 C Therefore the third program starts not at 140 C given by adding the final increment to 110 C but at 130 C determined by End Temp 20 C Ramp Time s Enter a value corresponding to Ramp Time in the heating temperature program In the ashing test function the start and end temperatures are f...

Page 438: ...o background absorption occurs This may cause a rise in the reference signal When the concomitant substance is vaporized completely the background absorption due to the vapor will end Therefore the reference signal falls and returns to the baseline In the background detection function it is first judged that the background was detected upon detection of a rise in the reference signal beyond the De...

Page 439: ... in an ashing test will be adopted 2 Generally a sample containing much concomitant matter tends to cause a rise in the reference signal at the ashing stage On the other hand the reference signal may be too low to detect depending on a sample containing an extremely small amount of concomitant matter or measuring wavelength In such cases the same ashing time as the Ramp Time s value set in an ashi...

Page 440: ...default value should be used Input range 0 0001 to 1 0000 Abs Detection End Enter the REF absorbance at which it is judged that background absorption ended after it had been detected Usually the default value should be used Input range 0 0001 to 1 0000 Abs Ash addition This function is provided for adding one more ashing stage under the determined conditions after an ashing test and then executing...

Page 441: ...by clicking its check box and an atomization test can be performed under the set conditions Fig 10 12 Atomize Test Window Set the following items Start End Temp C Enter the start end temperature in the Atomize Test Usually enter a temperature a few hundred degrees lower than the default atomization temperature Input range 50 to 2800 C Max Temp C Enter the maximum temperature when raising the atomi...

Page 442: ...0 30 200 mL min Gas Type Select the desired kind of carrier gas in the atomization stage between Normal and Alternate Be sure to select Normal argon gas Judge Select a method for optimum value judgment depending on the result of Atomize Test heating temperature graph Put a check mark in either Sensitivity or Repeatability check box NOTE This judgment method cannot be changed in the Data window aft...

Page 443: ... and start measurement Temp Program Development function displays a message on the measurement replicate after clicking Verify button Fig 10 13 Measurement Replicate Announcement Window NOTE Choose samples to be used for this function with absorbance in the range of 0 01 0 25 and background absorbance REF of 1 0 or less An error message The sample is inadequate for the test appears when the value ...

Page 444: ...of the drying starting temperature is displayed Ashing temperature graph button Ashing temperature graph is displayed Absorption sensitivity in the ashing temperature is displayed Atomization temperature ABS graph button Atomization temperature ABS graph button is displayed Absorption sensitivity in the atomization temperature is displayed Atomization temperature RSD graph button Atomization tempe...

Page 445: ...be made according to the comparison of absorption sensitivity when changing the Start End Temp in the Ash Test 1 When the absorption sensitivity falls 10 or more the test will be terminated The temperature just before the sensitivity falls will be judged as the Start End Temp 2 If the absorption sensitivity falls twice in succession though the fall lies within 10 the test will be terminated The te...

Page 446: ...ndition that causes the first sensitivity dip will be judged as the Start End Temp 3 If an atomization test is terminated without satisfying the end conditions in 1 and 2 the maximum atomization temperature entered for Temp Program Test Conditions will be judged as the Start End Temp NOTE When the end conditions in 1 and 2 are met the test of the relevant element will be terminated and the procedu...

Page 447: ...t for Copy Method dialog box will be displayed Specify elements for reflecting the heating temperature program automatically generated by the Temp Program Development onto the Method Fig 10 15 Object Element for Copy Method Object Element Select elements by clicking either radio button for reflecting the execution result of the Temp Program Development All Elements Targets all the elements subject...

Page 448: ...tical conditions for the selected element will be reflected and the Method window will appear NOTES 1 When reflecting the program onto the Method the Temp Program Development check box is automatically turned off For using the Temp Program Development function again turn on the Temp Program Development check box and assign the parameters 2 If a test is stopped midway and the sequence is terminated...

Page 449: ...10 5 Reflecting on Analysis Conditions 10 24 Fig 10 16 Method Window Unmark the checkbox ...

Page 450: ...he lamp house and replace the lamp with the correct one Sample viscosity is too high Check the state of aspiration while aspirating the sample and reduce its viscosity by dilution or decomposition Or slow the injection speed of autosampler Interference by coexisting substance in the sample is large Check in comparison with the sensitivity for standard sample Reduce coexisting substances concentrat...

Page 451: ...piration while aspirating the sample and reduce its viscosity by dilution or decomposition Or slow the injection speed of autosampler Baseline is unstable The lamp has been deteriorated Check the lamp spectrum and replace the lamp when required Lamp current is inappropriate Correct the lamp current The lamp element is wrong Check the lamp house and replace the lamp with a correct one Noise is larg...

Page 452: ... 7 2 Cleaning cuvette 5 28 Changing calculation mode 4 23 Changing sample unit 4 24 Changing sample name 4 23 Check of instrument 1 1 Comment 4 5 Concentrating sample 5 34 Concentration table 4 3 Copy dry stage 3 13 Copy method 5 38 Customized report 4 28 D Data file 2 9 Deleting and restoring data 4 22 Dilution factor 3 21 Diluting sample 5 35 E Existing working curve 5 24 Eco mode 5 47 ...

Page 453: ...thode lamp 1 2 I Injection Speed 3 25 Instrument Diagnosis 9 1 J Judgment standards for automatic generation of temperature program 10 20 L Lamp Spectrum 3 41 Lamp current 3 7 M Manual mode 8 1 Matrix modifier 5 22 Measuring an organic solvent sample 3 46 Menu bar 2 5 Method file 2 9 Modifier 5 15 N Nozzle Adjustment 3 43 O Offline 2 2 Online 2 2 Optical temperature control equation 8 5 ...

Page 454: ...dition 5 12 Simple standard addition method ex furnace addition 5 16 Slit width 3 6 Specification of baseline 4 21 Status bar 2 6 Standard addition method in Furnace addition 5 12 Standard addition method ex Furnace addition 5 4 Stop 3 52 T Table of each element 4 3 Template 4 26 Temperature program 3 11 Temperature program development function 10 1 Temperature control 3 9 Time constant 3 7 Troubl...

Page 455: ...INDEX 4 V Verify 3 34 W Working curve graph 4 1 Wavelength accuracy 9 1 ...

Page 456: ...INSTRUCTION MANUAL 7J1 9027 000 Ver 1 February 2016 MODEL HFS 4 HYDRIDE FORMATION SYSTEM ...

Page 457: ... Hitachi High Tech Science Corporation with all rights reserved No part of this manual may be reproduced transmitted or disclosed to a third party in any form or by any means without the express written permission of Hitachi High Tech Science Corporation 3 Hitachi High Tech Science Corporation assumes no liability for any direct indirect or consequential damages arising from use not described in t...

Page 458: ...jury For proper use of the instrument be sure to read this manual and the instruction manuals for the ZA3000 series carefully before operation Keep this manual in a safe place nearby so that it can be referred to whenever needed ABOUT THIS MANUAL This manual describes the operation and cautions for the HFS 4 Hydride Forming System Be sure to read this manual prior to use the system For the operati...

Page 459: ...rectly connected to a low voltage power supply network which supplies buildings used for domestic purpose And this instrument is also designed to comply with table 1 Immunity test requirements for equipment intended to be used in a basic electromagnetic environment in the above European Norms If the instrument is used near an intense electromagnetic source however interfering noise may be given to...

Page 460: ...urn and collection systems available Information on Disposal for Users 1 In the European Union If you need to discard this product or discard user serviceable parts Please contact local sales representative or distributor who will inform you of the recycle of the product You might be charged for the costs arising from take back and recycling 2 In other Countries outside the EU If you wish to disca...

Page 461: ...y This instrument can receive only a charge free repair if it malfunctions due to a defect in workmanship within the period of warranty However a substitute part may be used for repair or replacement with an equivalent product may be made instead of repair For example such system components as a personal computer and printer to be updated frequently for improvement may not be available in original...

Page 462: ... due to use or usage not described in this manual or due to repair attempted not under our control g Failure due to maintenance or repair by a service agent not approved or authorized by us h Failure due to relocation or transport not under our control after initial installation i Failure due to disassembly modification or relocation not approved by us j Failure due to acts of God including a fire...

Page 463: ... SCOPE OF THIS WARRANTY Service Life of This Instrument This instrument has a useful service life of seven years after the date of its initial use installation which is estimated under the condition that periodic maintenance checkup replacement of life limited parts and repair of worn parts are carried out as specified in the present instruction manual In use of the instrument under standard opera...

Page 464: ...ice office of our sales representative b For service after the warranty period consult our sales representative or service office of our sales representative with regard to a maintenance and inspection service contract c Maintenance service is available to allow system operation for 7 years after its delivery During this period the maintenance of units or parts having a short product cycle may ent...

Page 465: ... are available at the manufacturer or your site For further information contact our sales representative These seminars and courses are available on a chargeable basis Other Precautions Handling of Chemicals and Samples 1 The user is responsible for following relevant legal standards and regulations in the handling storage and discarding of chemicals and samples used in analytical operations of th...

Page 466: ...g possible injury or death every safety message that follows this symbol shall be obeyed DANGER Indicates an imminently hazardous situation which if not avoided will result in death or serious injury WARNING Indicates a potentially hazardous situation which if not avoided can result in death or serious injury CAUTION indicates a potentially hazardous situation which if not avoided may result in mi...

Page 467: ...ollow the original usage of the product and the usage specified in this manual Never attempt modification of the instrument use of a part other than specified nor instrument operation with safety devices released because this is dangerous Do not perform operations other than those described in the instruction manual If any problem occurs on the instrument contact our sales representative or servic...

Page 468: ...ytical results be unobtainable but also personal injury may be caused Precautions on Use In analysis with the atomic absorption spectrophotometer flame ignition is performed A fire or explosion may be caused if operation is carried on in an abnormal condition such as abnormal sound abnormal odor smoke or gas leak Be sure to carry out analysis in the presence of the analyst Avoid unattended operati...

Page 469: ...stricted to the items described in this manual Before maintenance read the relevant instructions carefully Never attempt maintenance not described in the manual Failure to do so could cause malfunction of the instrument or personal injury If a warning label is deteriorated due to secular change or damaged contact our service office Replace the life limited parts of the instrument with new ones at ...

Page 470: ...on of Pacemaker This instrument utilizes a permanent magnet of 0 9 tesla in the burner unit and another of 1 0 tesla in the atomizer furnace There is a danger of faulty operation of a cardiac pacemaker due to the strong magnetic field produced A person who uses a pacemaker should not come within one meter of the instrument or should avoid handling the instrument altogether Section 1 Section 3 ...

Page 471: ... by referring to SDS Safety Data Sheet that provides information about material characteristics and handling Wear proper protective clothes e g safety goggles and gloves to avoid direct contact between the skin and the reagent Ventilate the laboratory room adequately to prevent accidental inhalation of harmful vapor Section 3 Accident Cased by Deteriorated Part Gas leak water leak electrical leak ...

Page 472: ...river near the magnet Section 1 Section 3 Injury due to Suction into Pump There is a possibility of your hand or hair being sucked into the pump Make sure to attach the pump cover when operating the system Section 3 Section 4 High Temperature The heated absorption cell and cell holder become very hot during measurement Touching them could result in burns Absolutely avoid touching the cell or its h...

Page 473: ...ul about water leakage Improper connection of the pump tubes may cause liquid leakage Be sure to securely tighten the screws of the nipples Section 1 Strong Magnetic Fields The strong magnetic field generated by the magnet may cause damage to a watch or magnetic card Avoid bringing such objects near the magnet Section 1 Section 3 ...

Page 474: ...ARY Warning Label The label shown below is attached to the Model HFS 4 hydride formation system Danger of being sucked in Attached at the top of Model HFS 4 Danger of the electric shock Attached at the side of Model HFS 4 ...

Page 475: ... Signal Word SAFETY 1 General Safety Guidelines SAFETY 2 Warning Indications Appearing in this Manual SAFETY 5 Warning Label SAFETY 9 1 INSTALLATION FOR CUSTOMER S REFERENCE 1 1 Location 1 1 1 1 1 Installation Table and Layout 1 1 1 1 2 Site Requirements 1 1 1 2 Required Equipment 1 2 1 2 1 Power Supply 1 2 1 2 2 Gases 1 2 1 3 Check of Standard Parts 1 3 1 4 Items to be Prepared by User 1 3 1 5 As...

Page 476: ...3 11 3 8 Closing Operations 3 12 3 9 Measurement with Autosampler 3 13 4 MEASUREMENT USING FOUR LIQUIDS 4 1 Principle 4 1 4 2 Reagents 4 2 4 3 Sample 4 3 4 4 Setting of Reagents 4 4 4 5 Measurement Using Four Liquids 4 4 4 5 1 Preparation for Measurement Using Four Liquids 4 4 4 5 2 Operation of Measurement Using Four Liquids 4 6 5 MAINTENANCE 5 1 Replacement of Pump Tube 5 1 5 2 Replacement of Fu...

Page 477: ...ithstanding a load of at least 20 kg Fig 1 1 Layout of HFS 4 top view 1 1 2 Site Requirements Basically the site requirements are the same as for the AAS main unit The elements to be measured by this system have relatively shorter analytical wavelengths and are apt to be affected by the surrounding environment Take special care to avoid the followings Exposure of flame to direct drafts from an air...

Page 478: ...terminal with a grounding resistance of 100 ohms or less 1 2 2 Gases Prepare compressed air compressor acetylene and argon gases The specification of the Argon gas for this system are given in Table 1 2 Table 1 2 Argon gas Specification Gas Pressure Regulator Supply Pressure secondary pressure setting Argon Primary 25 MPa Secondary 1 MPa Full scale 500 kPa Attach a stop valve to the terminal of th...

Page 479: ... having a capacity of about 5 L and made of glass or resin NOTE Do not use an airtight bottle for the waste bottle 1 5 Assembly At the time of shipment the flow channel is configured for measurement using three liquids sample hydrochloric acid and sodium borohydride The procedure for setting the three liquid flow channel is given in 1 5 1 Follow the procedure to make necessary connections and sett...

Page 480: ... out of the model HFS 4 The tubes led out of the unit have markers for identification HCl red NaBH4 green Sample none NOTE 1 In connection of each tube screw in the nipple completely If connection is incomplete poor suction or leakage may occur NOTE 2 Each tube should be connected correctly while checking the identification marker Fig 1 2 Setting of Pump Tubing Nipple groove Pump rotor INLET side ...

Page 481: ...of the acid bottle part No 171 6336 and sodium borohydride bottle part No 171 6337 and connect them to the hydrochloric acid suction tube and sodium borohydride suction tube respectively Put these tubes into the respective bottles set the caps and place the bottles on the furnished reagent tray part No 171 6395 CAUTION Be careful about water leakage An incomplete connection of the pump tubes may c...

Page 482: ...lass If the separator is broken you may suffer an injury Adequate attention should be paid when handling the separator 2 Connect the drain tubes part No 171 6327 to the separator part No 7J1 7400 provided as an accessory 3 Put the pure water in the separator 4 Insert the fluoro rubber plug coming from the left side face of HFS 4 into the separator by about 13 mm Then attach the separator to the se...

Page 483: ...1 7 Fig 1 5 Installation of Separator NOTE Tube and fluoro rubber plug should be connected securely to the separator After connection visually check that water is no leaking Drain tubes Separator ...

Page 484: ...utomatically added by the pump Follow the procedures below to reconfigure the flow channel 1 5 3 1 Setting of Reaction Coil 1 Remove the screws from the right and left sides and the back of the instrument and detach the cover Fig 1 6 Internal Flow Channel 2 Remove the tube with band marking 4 Fig 1 7 Internal Flow Channel after Removing Tube with Band Marking 4 Tube with band marking 4 ...

Page 485: ...ing agent suction tube to port A Select the tube with band marking 8 from the reducing agent mixing tube assembly and connect it to port B from which the tube with band marking 4 was removed Select the tube with band marking 9 C from the reducing agent mixing tube assembly and connect it to port D from which the tube with band marking 4 was removed Fig 1 9 Tube Connections for Four liquid Flow Cha...

Page 486: ... Plate of Tube Assembly 6 Attach the cover and fix it with the screws 1 5 3 2 Setting of Pump Tubing 1 Raise the support clamp lever and put the tube support down 2 Connect the four suction tubes provided as accessories sample suction tube part No 7J1 7300 hydrochloric acid suction tube part No 7J1 7305 sodium borohydride suction tube part No 7J1 7310 and reducing agent suction tube part No 7J1 73...

Page 487: ...tion tube hydrochloric acid suction tube sample suction tube and reducing agent suction tube Then on the INLET side set the nipple groove on the tube guide while aligning each tube with the groove on the pump rotor 4 Remove the head cap and inner cap from each of the acid bottle part No 171 6336 sodium borohydride bottle part No 171 6337 reducing agent bottle part No 7J1 7338 and connect them to t...

Page 488: ...andling the instrument altogether CAUTION The strong magnet field generated by the flame magnet can cause severe injury Do not bring metal objects including iron such as a screwdriver near the magnet NOTICE The strong magnet field generated by the flame magnet may cause damage to a watch or magnetic card and so on Avoid bringing such objects near the magnet 1 Turn the burner height adjustment knob...

Page 489: ... the front side of the magnet 4 Turn the magnet counterclockwise at 180 Then remove another two shield fixing screws 5 Attach the heat shield plates inside of the magnet and fix loosely with the fixing screws Fig 1 14 Installation of Heat Shield Plates 6 Turn the magnet to the opposite direction at 180 and fix the shield plates with the fixing screws in the opposite side a little tightly Shield fi...

Page 490: ...s hose connection is insufficient argon gas may leak from the joint Be sure to check for gas leakage after hose connection NOTE 2 Note that the accompanying gas hose with a nylon tube 7J1 7510 can also be connected to the AAS main unit Note that if you connect and disconnect the hose every time you use the instrument the joint may be worn faster or the nylon tube may be damaged or deformed When ar...

Page 491: ... straight downward so that the liquid inside flows smoothly without stagnating The tube must be cut at a length that does not allow its end to be immersed in the waste liquid NOTE 1 Be sure to dispose of the waste solution with the proper procedure NOTE 2 Avoid using a sealed type waste liquid container Joint with metal nipple Gas supply side HFS 4 side Nylon tube ...

Page 492: ...ous injury or death due to electric shock from the mains voltage Before connecting the power cord make sure that the power switch of the main unit is being turned OFF Absolutely do not attempt to disassemble or to modify the instrument WARNING Electric Shock due to Improper Grounding Improper grounding may cause electric shock hazard Provide the instrument with a correct grounding system Do not co...

Page 493: ...ront Panel Fig 2 1 Front Panel Reagent tray Pure water for washing bottle Acid bottle Contains HCI Sodium borohydride bottle Contains NaBH4 solution Separator Separates hydride gas and solution Preliminary reducing agent bottle Contains KI solution Pump rotor ...

Page 494: ... 2 2 1 2 Pump Unit Fig 2 2 Pump Unit 2 1 3 Rear Panel Fig 2 3 Rear Panel Fuse holder Power connector Nipple Tube guide Pump tube Support clamp lever Tube support Rotor Identification marker Ar GAS INLET ...

Page 495: ...ds by the pump In the three liquid flow channel sample or distilled water hydrochloric acid and sodium borohydride are constantly flowed by operating the pump to produce hydrogen In addition argon gas is flowed at a constant rate for carrying hydride After the sample is delivered into the reaction coil where hydrogen is always produced it reacts with hydrogen in nascent state to form hydrides whic...

Page 496: ... agent flow rate About 1 mL min Carrier gas Ar 100 mL min 200 kPa fixed Pump Peristaltic pump Reagents NaBH4 and HCl Reducing agent KI and Ascorbic Acid Power requirements 100 115 220 230 240V AC 50 60 Hz common 50 VA Dimensions and weight 29 W 20 D 23 H cm approx 8 kg These specifications are applicable only to measurement using four liquids ...

Page 497: ...ure water and adjust the total volume to 100 mL 4 10 Ascorbic Acid AA Solution necessary only for arsenic measurement Dissolve 10 g of L ascorbic acid in pure water and adjust the total volume to 100 mL 5 Standard Solutions Dilute a commercially available standard solution approx 1 000 mg L such as arsenic As or selenium Se NOTE 1 When using a toxic corrosive or stimulative reagent be careful not ...

Page 498: ...ose hydrochloric acid potassium iodide and ascorbic acid are used as a reducing agent To measure selenium however do not use potassium iodide but use hydrochloric acid only because valence of selenium will be reduced to 0 by adding potassium iodide For antimony measurement add thiourea Sample preparation procedure is given below for an example of arsenic a Standard solutions for working curve arse...

Page 499: ... 15 ug L values are required for condition input since sample is to be diluted twofold NOTE 1 When Se is measured after As measurement the absorbance of Se may decrease because of KI remained in the flow channel In case of measurement for both of As and Se measure Se first whenever possible When Se has to be measured after As measurement wash the flow channel by aspirating HCl solution e g 1 0 mol...

Page 500: ... the following conditions in the AAS Method window Signal Mode BKG Correct Calculation Mode Integral Time Constant 1 0 s Atomizer Standard Burner Flame Type Air C2H2 Fuel Flow 1 2 L min Burner Height 10 0 mm Delay Time 5 s Measurement Time 5 s Determination Mode Working Curve Optimum conditions should be determined by measuring a sample solution Set parameters for STDs unknown samples and others 2...

Page 501: ...ould not come within 1 meter of the instrument or should avoid handling the instrument altogether CAUTION Strong Magnetic Fields The strong magnet field generated by the flame magnet can cause severe injury Do not bring metal objects including iron such as a screwdriver near the magnet NOTICE Strong Magnetic Fields The strong magnet field generated by the flame magnet may cause damage to a watch o...

Page 502: ...cell holder and fix it with the fittings Be aware that upper lower shape of fitting 1 is different At this time do not tighten the fitting screws so as to adjust the cell position Fig 3 2 Assembled Absorption Cell and Silicone Tube Fig 3 3 Attachment of Fitting 1 Absorption cell Fitting 2 Cell holder Holder fixing screw Fitting screws Fitting 1 Silicone tube ...

Page 503: ...ube 4 Place the cell holder onto the flame magnet so that the absorption cell is parallel between the gap of magnet pole pieces 5 Tighten the holder fixing screw at the right side of the cell holder Fig 3 5 Attachment of Cell onto the Magnet Holder fixing screw Cell holder Absorption cell ...

Page 504: ... cell position so that the absorption cell and light beam form concentric circles on the paper at both ends of the cell Left end Right end Fig 3 6 Adjustment of Cell Position with use of a piece of thin paper 7 Tighten the fitting screws firmly Thin paper Light beam Absorption cell ...

Page 505: ... support onto the pump tube and set the support clamp lever in position by lowering it NOTE 1 Incorrect setting of reagent bottles or pump tubes can lead to inaccurate measurement results NOTE 2 Lower the support clamp lever securely so that it becomes horizontal CAUTION Your hand or hair may be sucked into the pump Fig 3 7 Setting of Support Clamp Lever ...

Page 506: ... rotate 4 Visually check to ensure that liquid is flowing in each pump tube 5 Ignite the flame NOTE 1 Check the gas leak before use and power on of exhaust duct NOTE 2 The fuel flow rate should to be set at about 1 2 L min when the absorption cell is used A flow rate of normal flame condition about 2 0 L min may result in ignition failure NOTE 3 Although the color of the thermal tape on the flame ...

Page 507: ...er completion of each sample measurement 5 Carry out measurement of samples in the same way as above NOTE The absorption cell and cell holder become very hot when the flame is ignited There is a danger of burns upon touching them Do not touch the cell and cell holder when the flame is ignited Wait until the cell and cell holder cool down before handling them CAUTION High Temperature The absorption...

Page 508: ... water turn off the power switch of the HFS 4 Do not stop supplying Ar gas at this time 5 Raise the tube support clamp lever to loosen the tube support NOTE If the tube support remains set in place the tube will be deformed and reach the end of its service life earlier 6 About 5 minutes after turning off of HFS 4 stop Ar gas supply 7 Detach the absorption cell and cell holder after their cooling d...

Page 509: ...e solution NOTE 1 When Se is measured after As measurement the absorbance of Se may decrease because of KI remained in the flow channel In case of measurement for both of As and Se measure Se first When Se has to be measured after As measurement wash the flow channel by aspirating HCl solution e g 1 0 mol L for about 10 min NOTE 2 When the measurement is continued for long time more than 1 h the a...

Page 510: ...nel however the reducing agent is automatically added by the pump This allows users to skip the process of adding a reducing agent to each sample Fig 4 1 shows a diagram of the four liquid flow channel In the four liquid flow channel a sample is mixed with hydrochloric acid first Then it is mixed with the reducing agent and delivered to the reaction coil 1 m in which the pentavalent arsenic in the...

Page 511: ...igher in pure water and adjust the total volume to 500 mL 4 Standard Solutions Dilute commercially available standard solution or arsenic approx 1 000 mg L NOTE 1 When using a toxic corrosive or stimulative reagent be careful not to incur a physical inflammation or injury Reagents should be properly treated by referring to SDS Safety Data Sheet that provides information about material characterist...

Page 512: ... sample preparation methods a Standard solutions for working curve arsenic 0 1 2 5 ug L a Hydrochloric acid special grade or higher 10 mL b 1 mg L arsenic standard solution 0 10 20 50 uL Add a and b and adjust the total volume to 20 mL with pure water Actual concentrations are 0 0 5 1 2 5 µg L However 0 1 2 and 5 µg L values are required for condition input since sample is to be diluted twofold b ...

Page 513: ...s 4 5 1 Preparation for Measurement Using Four Liquids 1 As preparation for the measurement set the conditions of the AAS main unit Refer to 3 4 Setting of Conditions 2 Set the absorption cell For details refer to 3 5 Setting of Absorption Cell 3 Set up the HFS 4 for the measurement Check that each of the four pump tubes is set in the roller groove of the pump Then push the tube support onto the p...

Page 514: ...s to rotate NOTE If the argon gas is not supplied to the HFS 4 the system does not run Check the supply of argon when the pump does not start to rotate 6 Visually check to ensure that liquid is flowing in each pump tube 7 Ignite the flame NOTE 1 The fuel flow rate should to be set at about 1 2 L min when the absorption cell is used A flow rate of normal flame condition about 2 0 L min may result i...

Page 515: ...constant 4 5 2 Operation of Measurement Using Four Liquids 1 Perform the measurement operation using the four liquid flow channel Refer to 3 7 Measurement 2 After measurement of the last sample perform the closing operation Refer to 3 8 Closing Operations 3 When using the autosampler delay time of the the four liquid flow channel will be longer than the three liquid flow channel by the length of t...

Page 516: ...quid flow channel is the same as the three liquid flow channel because the sample flow rate of the flow per unit time does not change When using the four liquid flow channel delay time will be longer than the three liquid flow channel by the length of the reaction coil When measuring both arsenic and selenium using the four liquid flow channel the selenium is measured earlier than arsenic It shoul...

Page 517: ...the frequency of use 5 1 Replacement of Pump Tube When a pump tube is deteriorated or damaged torn replace with a spare The procedure is instructed below 1 Release the support clamp lever by raising it 2 Turn the tube support down 3 Disconnect the pump tube from the rotor Fig 5 1 Removal of Pump Tube 4 Disconnect the old tube from the nipple 5 Connect a new tube to the nipple using the furnished s...

Page 518: ...imultaneously 5 For connecting the pump tubes to the nipples match the identification markers put on the suction tubes Red for HCl green for NaBH4 blue for preliminary reducing agent none for Sample 6 Each tube should be connected securely Otherwise poor aspiration or leakage may be caused 5 2 Replacement of Fuse 1 The fuse holder is at the upper side of the power cord socket on the rear of HFS 4 ...

Page 519: ...uate Check gas pressure Adjust gas pressure to 500 kPa The argon gas cylinder is empty Check the residual pressure in the cylinder Replace it with a full cylinder 2 Reagent cannot be aspirated while pump is operating Tube support is not set Check tube support Set tube support firmly Pump tube is separated from rotor groove Check tube length Adjust the length of pump tube and set the tube again Pum...

Page 520: ...tion has occurred inside connecting tube particularly in Se measurement Check connecting tube Eliminate condensation or replace the connecting tube 5 Bine is poor Ambient environment is normal Tip of drain tube is dipped into waste liquid Check the waste drain bottle Discard waste liquid Adjust the length of tube Argon gas flow rate is inadequate Check argon gas supply pressure Adjust supply press...

Page 521: ...gent 7J1 7341 15 piece set Tygon LMT 55 inner diameter 0 79 outer diameter 2 38 length 125 mm Part No 3 Absorption cell 7J0 8861 NOTE The absorption cell turns white as it is used The degree of turning white is depending on the use environment such as the continuous operating time the frequency of lighting up extinguishing the flame or the like When the cell has poorer sensitivity than before it s...

Page 522: ...6 2 6 3 Maintenance Parts Two time lag fuses are necessary Part No Time lag fuse 2 A 250 V J821396 1 pc NOTE The kind and capacity of a maintenance fuse must be the same as the existing one ...

Reviews: