572
D90
PLUS
LINE DISTANCE PROTECTION SYSTEM – INSTRUCTION MANUAL
OBSERVING CURRENT AND VOLTAGE PHASORS
CHAPTER 11: METERING
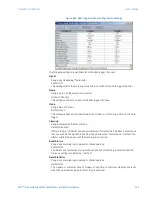
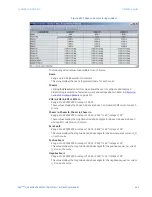
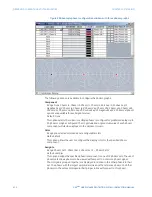
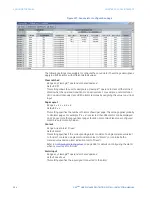
Figure 500: Example phasor configuration window with three phasor graphs
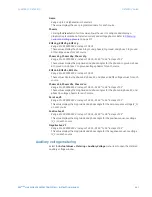
The following options are available to configure the phasor graphs.
Component
Range: None, Phasor Ia, Phasor Ib, Phasor Ic, Phasor In, Zero Seq I0, Positive Seq I1,
Negative Seq I2, Phasor Ig, Phasor Igd, Phasor Vag, Phasor Vbg, Phasor Vcg, Phasor Vab,
Phasor Vbc, Phasor Vca, Zero Seq V0, Positive Seq V1, Negative Seq V2, Phasor Vx (phasor
options are available for each signal source)
Default: None
This option selects the current or voltage phasor to configure for graphical display. Up to
50 phasors may be configured. The magnitude and angle actual value of each phasor
component will also be displayed in the adjacent column.
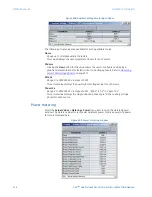
Color
Range: pre-selected colors and user-configurable colors
Default: Black
This option allows the user to configure the display color for the specified phasor
component.
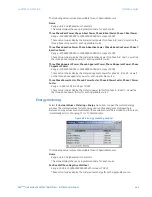
Assign to
Range: Phasor Set 1, Phasor Set 2, Phasor Set 3,..., Phasor Set 12
Default: <Empty>
This option assigns the specified phasor component to one of 12 phasor sets. The use of
phasor sets allows phasors to be viewed with respect to a common phasor signal.
Phasor signals grouped together are displayed in relation to the other phasors in their
set. The phasor with the largest amplitude is taken as the reference phasor, and other
phasors in the set are displayed in their proper ratios with respect to this phasor.

