PN A51387A
B
5-23
Setting View and Print Preferences
Creating a Preferences File
5
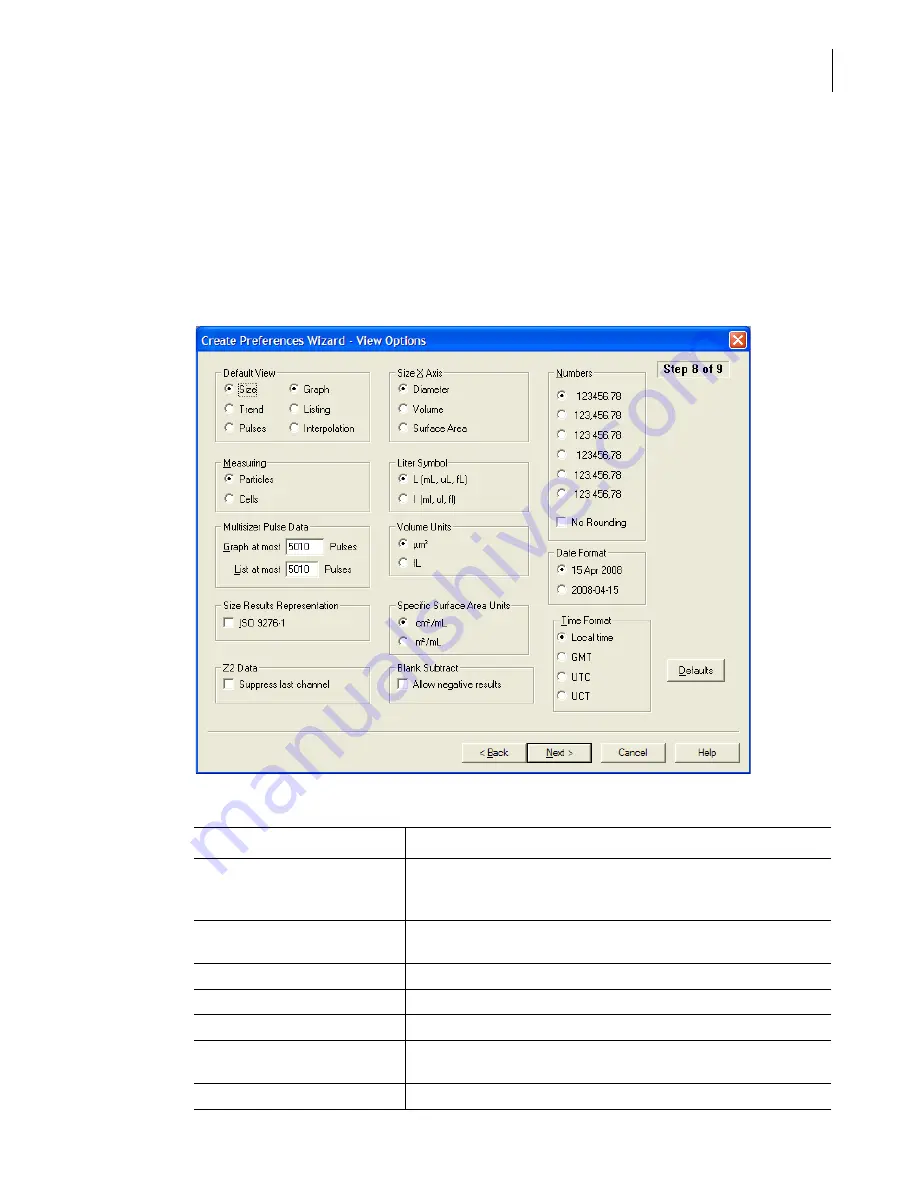
Preferences: View Options
Use Step 8 of the Create Preferences Wizard (View Options) or the View Options tab of the Edit
Preferences window to select the default graph or listing type that will appear when you complete
an analysis, and to select other analysis viewing preferences. These settings will apply to both on-
screen graphs or listings and printed reports.
For information on how to open the Create Preferences Wizard and the Edit Preferences windows,
see
, page
Table 5.6
Preferences Wizard: Set View Options
View Preferences
Description
Default View
Select one option in each column to choose how the analysis run is first
displayed when the run is complete. You can select Interpolation view
only if you select Size in the left column.
Measuring
Select Particles or Cells to change the description that appears on
graphs and listings. This setting will not affect analysis specifications.
Multisizer Pulse Data
Select a maximum number of pulses to appear in a graph or listing.
Size Results Representation
Use ISO 9276-1 specifications for Size graph axis labels.
Z2 Data
Select Suppress last channel.
Size X Axis
Select the value that will automatically appear on the X axis of the
graph (Diameter, Volume, or Surface Area).
Liter Symbol
Select the symbol you want to use.
Summary of Contents for Multisizer 4
Page 12: ...xii List of Figures ...
Page 14: ...xiv List of Tables ...
Page 22: ...PN A51387AB xxii Introduction Before You Start Warnings and Cautions ...
Page 42: ...PN A51387AB 1 20 Analyzer Overview Preparing the Analyzer for Sample Runs ...
Page 160: ...PN A51387AB 6 16 Analyzing a Sample Using Blank Runs ...
Page 232: ...PN A51387AB 10 8 Regulatory Compliance Additional Security Features ...


