PN A51387A
B
5-14
Setting View and Print Preferences
Creating a Preferences File
Including Blockage Monitor Data in Printed Reports
Use the Blockage Monitors pane in the Preferences / Printed Report window (page
) to select
how blockage monitor information will appear in the printed report. You can display blockage
monitor data as a Graph, a Listing, or both.
NOTE
The Multisizer 4 software saves blockage monitor data with every analysis. Printed reports can
display blockage monitor data independently of blockage settings in the SOM.
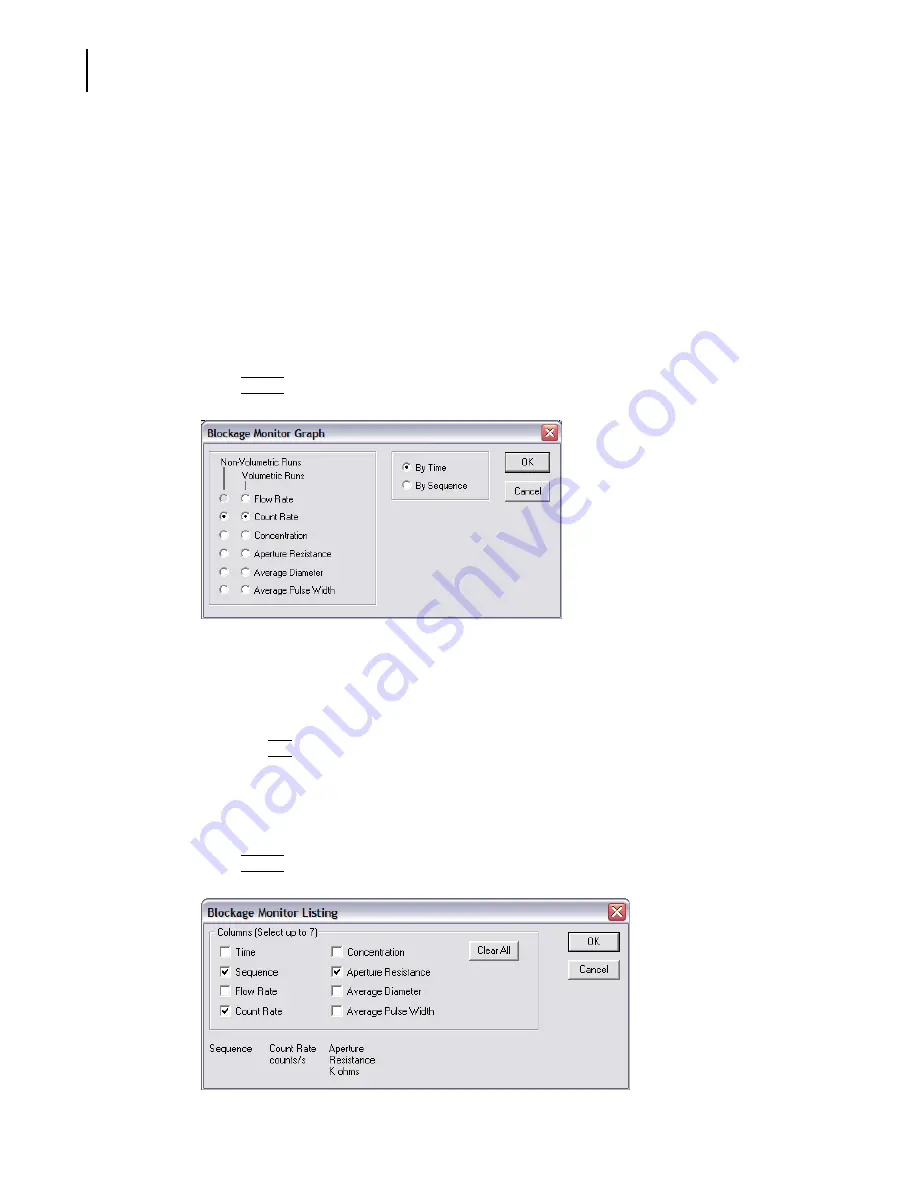
To show blockage monitor data in a graph:
1.
In the Pulse Data pane of the Preferences / Printed Report window (page
), select Graph.
2.
Click
(
Select
)
. The Blockage Monitor Graph window opens.
3.
In the Blockage Monitor Graph window:
a.
Select how blockage monitor data will appear for Volumetric Runs and Non-Volumetric
Runs.
b.
Select By Time or By Sequence.
c.
Click
(
OK
)
to save your settings.
To show blockage monitor data in a listing:
1.
In the Blockage Monitor Data pane of the Preferences / Printed Report window (page
select Listing.
2.
Click
(
Select
)
. The Blockage Monitor Listing window opens.
Summary of Contents for Multisizer 4
Page 12: ...xii List of Figures ...
Page 14: ...xiv List of Tables ...
Page 22: ...PN A51387AB xxii Introduction Before You Start Warnings and Cautions ...
Page 42: ...PN A51387AB 1 20 Analyzer Overview Preparing the Analyzer for Sample Runs ...
Page 160: ...PN A51387AB 6 16 Analyzing a Sample Using Blank Runs ...
Page 232: ...PN A51387AB 10 8 Regulatory Compliance Additional Security Features ...


