PN A51387A
B
5-13
Setting View and Print Preferences
Creating a Preferences File
5
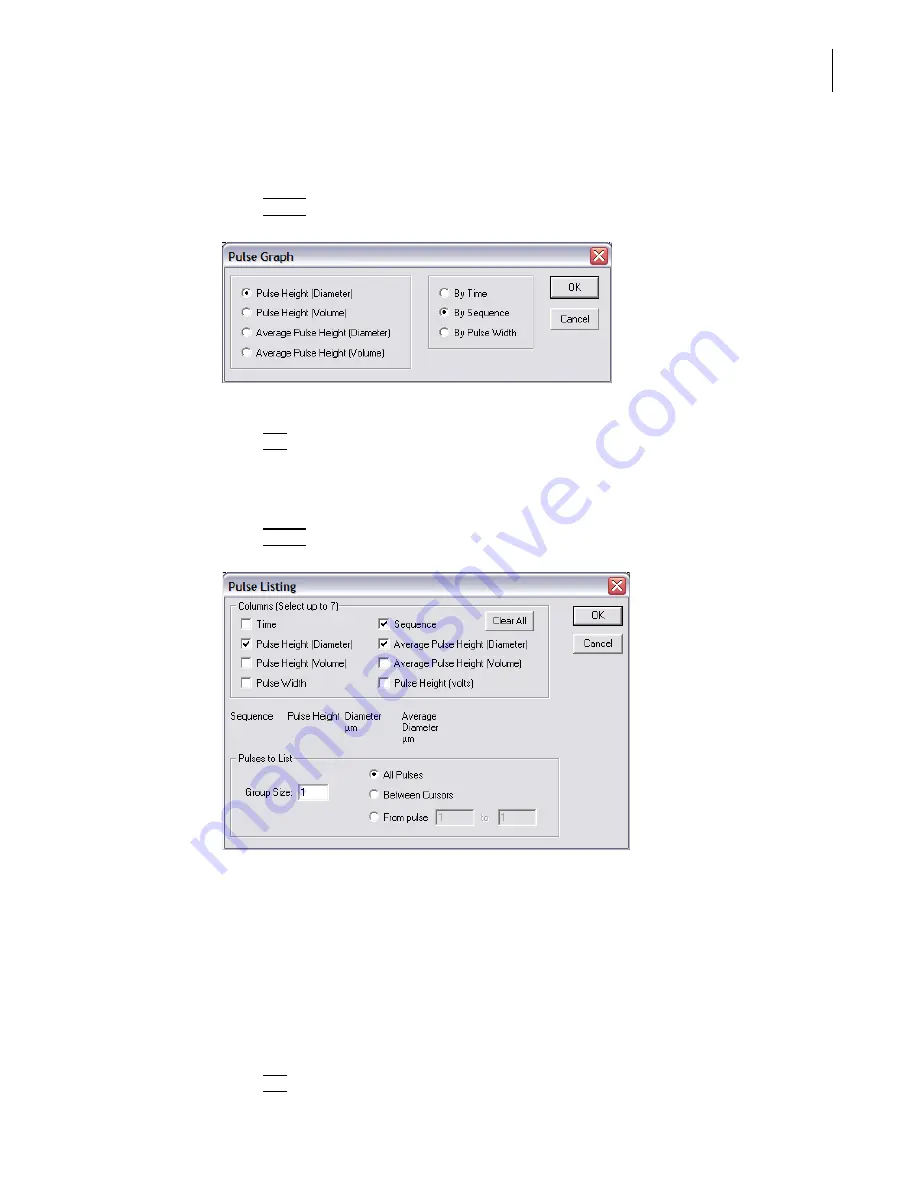
To show pulse data in a graph:
1.
In the Pulse Data pane of the Preferences / Printed Report window (page
), select Graph.
2.
Click
(
Select
)
. The Pulse Graph window opens.
3.
In the Pulse Graph window, select variables for the X and Y axes.
4.
Click
(
OK
)
to save your settings.
To show pulse data in a listing:
1.
In the Pulse Data pane of the Preferences / Printed Report window (page
), select Listing.
2.
Click
(
Select
)
. The Pulse Listing window opens.
3.
In the Pulse Listing window:
a.
In the Columns pane, select the values you want to include in the listing.
b.
In the Pulses to List pane, enter the Group Size.
•
Select All Pulses to display results from the full range of the analysis.
•
Select Between Cursors to display only results between your defined cursors. For
information on setting and moving cursors, see page
•
Select From pulse and enter specific points to limit the range without inserting cursors
in a graph.
4.
Click
(
OK
)
to save your settings.
Summary of Contents for Multisizer 4
Page 12: ...xii List of Figures ...
Page 14: ...xiv List of Tables ...
Page 22: ...PN A51387AB xxii Introduction Before You Start Warnings and Cautions ...
Page 42: ...PN A51387AB 1 20 Analyzer Overview Preparing the Analyzer for Sample Runs ...
Page 160: ...PN A51387AB 6 16 Analyzing a Sample Using Blank Runs ...
Page 232: ...PN A51387AB 10 8 Regulatory Compliance Additional Security Features ...


