


–
View
tab,
Graph
tab, and
Color
tab
All settings on these tabs only affect the way the data is displayed. You do
not need to run the measurement again. See
,
“How to Change the Colors of the Graph”
for details.
3
Press
OK
when you have made all required changes to close the
Properties
dialog box.
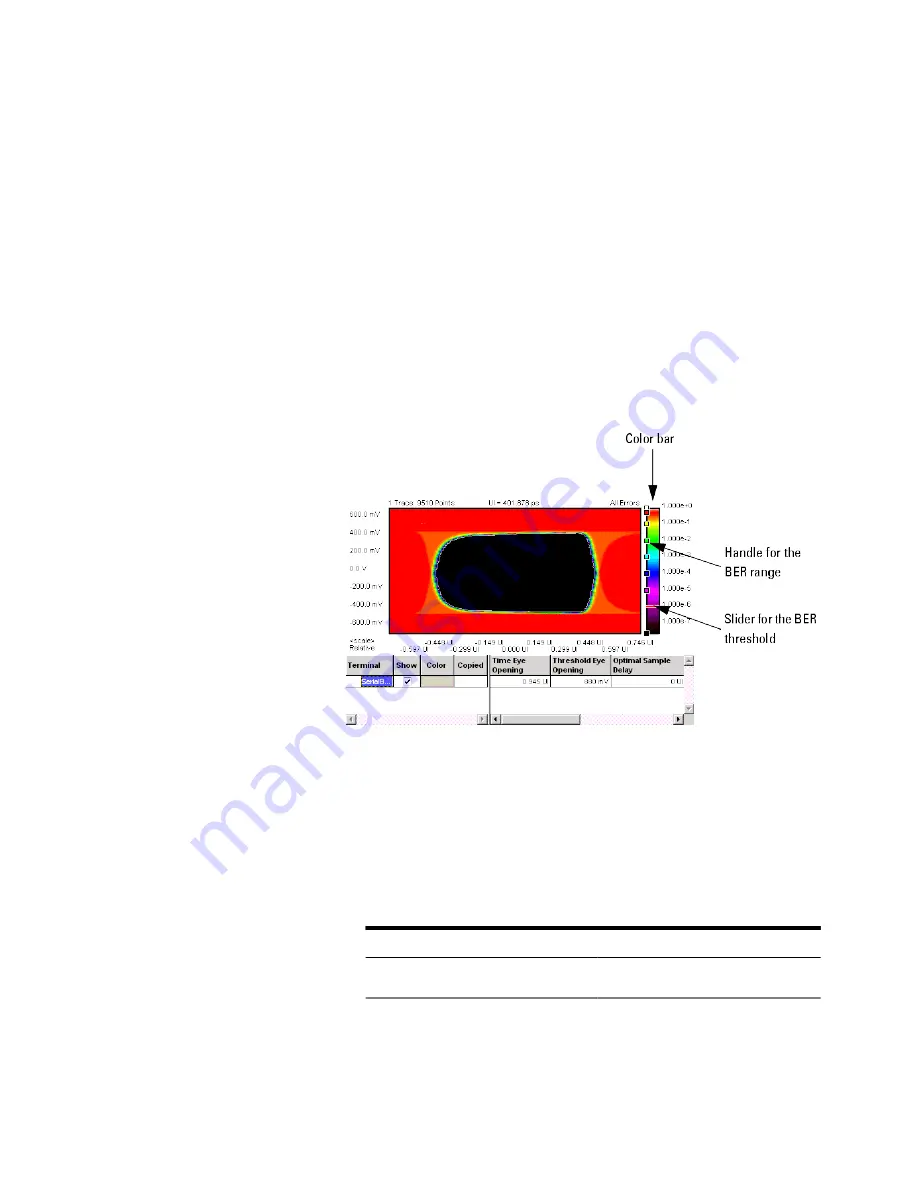
How to Use the Color Bar
The color bar at the right-hand side of the diagram shows the assignment of BER
thresholds to colors. These colors can be changed. In addition, the color bar
provides some useful options for controlling the display.
How to Add or Change Colors
If you have a mouse connected to your Serial BERT, you can add a color to the
color bar or change a color:
• From the context menu of the color bar, choose from the following display
options:
Table 30
Option
Description
Gradient
6
Advanced Analysis
292
Agilent J-BERT N4903B High-Performance Serial BERT
Summary of Contents for J-BERT N4903B
Page 1: ...S Agilent J BERT N4903B High Performance Serial BERT User Guide s Agilent Technologies ...
Page 10: ...10 Agilent J BERT N4903B High Performance Serial BERT ...
Page 36: ...1 Planning the Test 36 Agilent J BERT N4903B High Performance Serial BERT ...
Page 60: ...2 Setting up External Instrument s 60 Agilent J BERT N4903B High Performance Serial BERT ...
Page 120: ...3 Setting up Patterns 120 Agilent J BERT N4903B High Performance Serial BERT ...
Page 360: ...6 Advanced Analysis 360 Agilent J BERT N4903B High Performance Serial BERT ...
Page 468: ...8 Jitter Tolerance Tests 468 Agilent J BERT N4903B High Performance Serial BERT ...
Page 524: ...9 Solving Problems 524 Agilent J BERT N4903B High Performance Serial BERT ...
Page 566: ...10 Customizing the Instrument 566 Agilent J BERT N4903B High Performance Serial BERT ...