


8-14
TI71M01D06-01EN 3rd Edition: 2012.12.01
8.5 Details of the Display Group Function
This section describes the Display group that has the function for mainly displaying the drive
information.
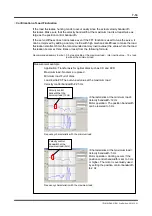
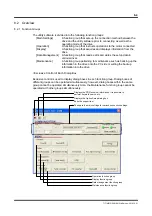
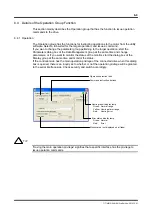
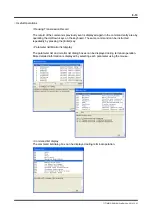
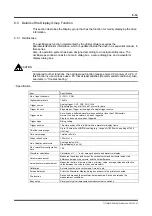
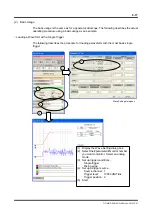
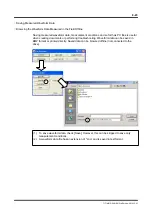
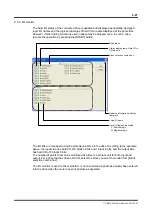
8.5.1 Oscilloscope
The oscilloscope function implemented by the utility software acquires the
#parameter/#monitor information, which is updated inside the drive in a sequential manner, in
time series.
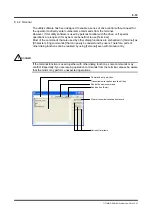
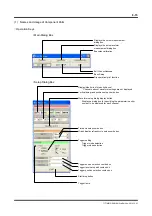
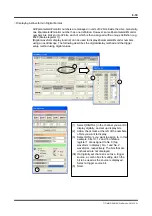
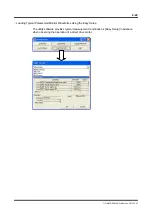
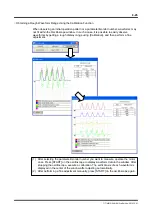
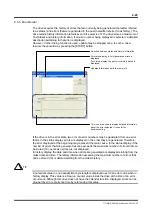
Also, its operation system has been designed according to an actual oscilloscope. The
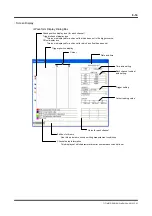
oscilloscope window consists of a main dialog box, a setup dialog box, and a waveform
display dialog box.
Compared to other functions, the oscilloscope function requires more CPU power of a PC. If
this function is used, please use a PC that at least satisfies [Recommended conditions]. Also,
see items in “Troubleshooting.”
Specification
Item Specification
No. of input channels
4 (CH1 ~ CH4)
Highest sample rate
10kS/s
Trigger source
Analog trigger: CH1, CH2, CH3, CH4
Digital trigger: Any of bit 0 to bit 7 of monitor data
Trigger function
Edge trigger: Trigger at the edge of a single trigger source
Trigger mode
Auto: Loads a buffered waveform sequentially at less than 100msec/div
Normal: Loads a waveform only when triggered
Single: Loads only once when triggered
Trigger slope
Rising, falling
Trigger position
10-point position of 0div to 9div within a waveform display frame
DC offset setup range
Up to 10 times the
±
UNIT/div setting (e.g., range of
±
10000 with a setting of 1000
UNIT/div)
Time setup range
1ms/div to 5s/div
Graph refresh cycle
100ms to 1s
No. of display waveforms
Analog display: 4CH
Digital display: 8 x 4CH
No. of waveform configuration
data
100
Waveform calculation
Calculation of +, -, *, and / among channels, and waveform display
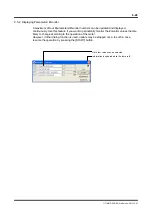
Cursor measurement
Measures the values and time of the vertical cursor and horizontal cursor, the
difference between the cursors, and the time difference
Auto waveform measurement
Measures the time, maximum value, minimum value, average value and effective
value between the cursors of any one waveform
Calibration
Automatic sets up the vertical axis, time axis, etc.
Screen hardcopy
Prints the Waveform Display dialog box window to the printer connected
File function
Saves and browses the waveform data measured. Saves and reloads the
measurement conditions.
Easy setup
Simply sets typical representative measurement conditions
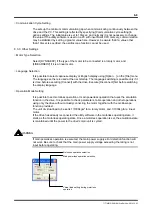
CAUTION