9-3
Section
Creating the Sample Data
370
Click on
, (returns to setting property) then click on
again.
Adjusting the size and position of the frame and % display
(7) Specify the trend graph and select [Edit] (menu bar)
→
[Select Object].
(8) In the list, specify [0%] (Line 1 display %) at the upper right of the trend
graph and drag it to the % display position for Data 1.
Reference: Even if elements are overlapped, you can select the desired element easily using
the [Select Object] function. For elements such as a trend graph that consist of
several elements, use the [Edit Object] function to make element selection easi-
er.
(9) Specify [–100%] (Line 2 display %) at the upper right of the trend graph
and drag it to the % display position for Data 2.
(10) Specify the trend graph frame and adjust the size and the position.
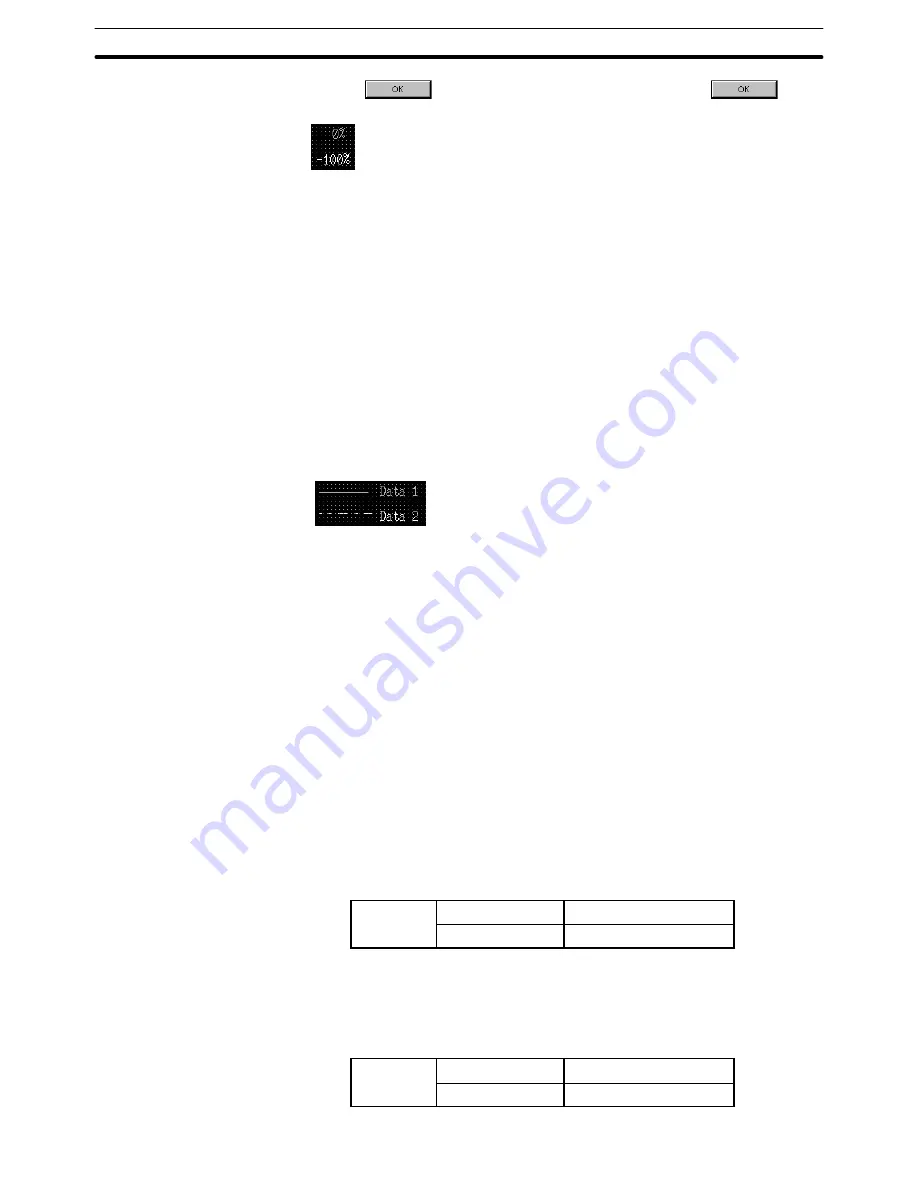
Displaying an example
Create the example of display using fixed display text and straight lines.
(11) Select [Objects] (menu bar)
→
[Fixed Display]
→
[Text].
(12) Click the mouse with the mouse cursor positioned at the “Data 1” display
position.
(13) Set “Data 1” in the character string setting (Fixed Display – Text) dialog
box.
(14) Adjust the “Data 1” display position.
(15) Select [Objects] (menu bar)
→
[Fixed Display]
→
[Polyline]. (Refer to 6-2-1
Polyline.)
(16) Drag the mouse cursor in the range (from the start point to the end point)
where a line is to be displayed to the left of [Data 1].
Set the line property as shown below.
General
Line Style
Solid
Line Color
Cyan
(17) Specify the drawn line and adjust the length and the position of the line.
(18) Create the example display of “Data 2” in the same manner.
Set the line property as shown below.
General
Line Style
Dot-dash
Line Color
White


