6-9
Section
Graphs
244
Pen Reco:
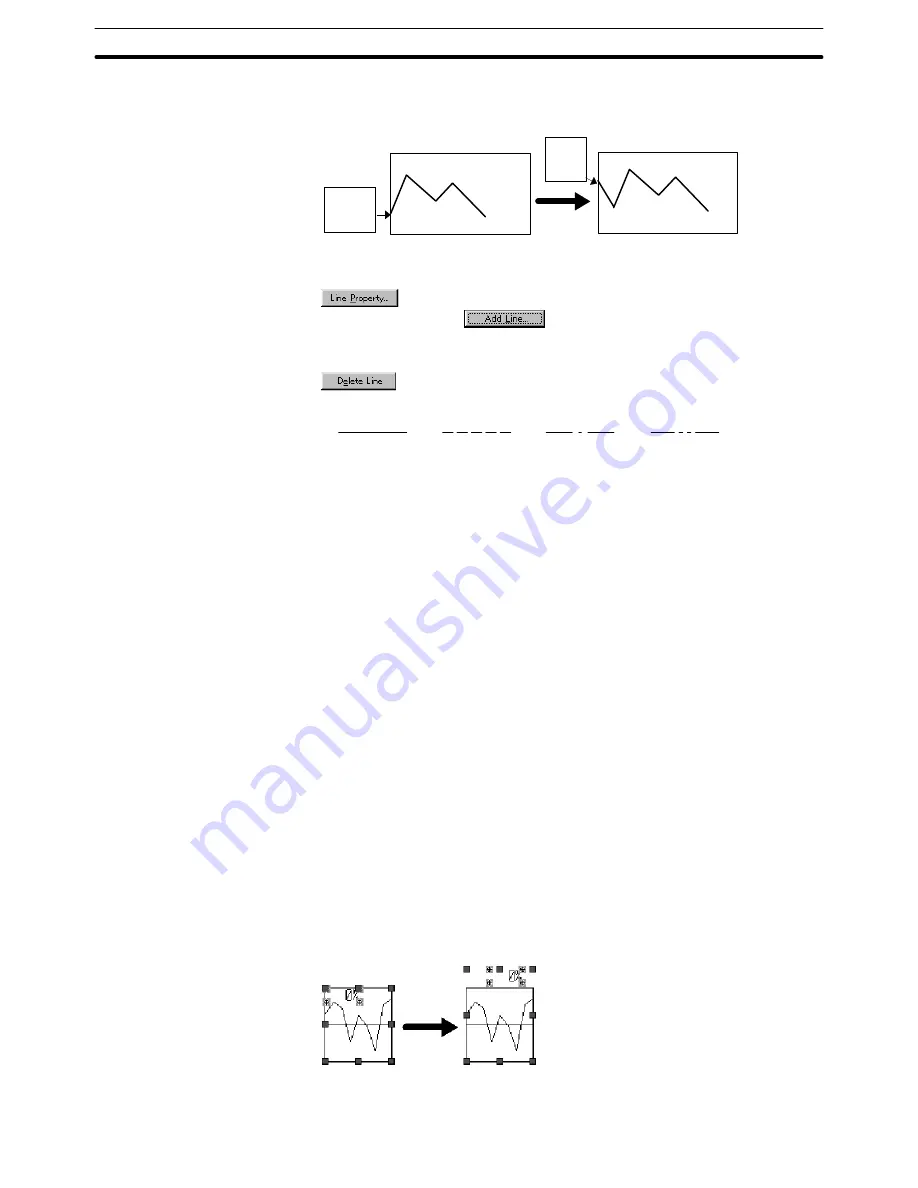
The latest drawing position is fixed and the entire graph moves in
the direction set for [Direction].
Present
drawing
position
Present display status
Present drawing position
Next
display
status
If you specify a trend graph element, only one broken line is displayed.
To modify the settings for the line, select the line to be modified and click on
. The line properties are displayed.
To add a line, click on
. A line is added and the line properties are
displayed for the added line. A maximum of 50 lines can be created.
To delete a line, select the line to be deleted with the “Settings” and click on
. The specified line is deleted.
The following four types of line are provided for displaying trend graphs.
Dot-dot-dash
Solid
Dash
Dot-dash
Set the line type with the [Style] property.
The intervals between points of a trend graph in the time axis is specified by
[Drawing Width]. The width is set as a number of dots.
The time intervals in which the drawing value of a trend graph is read is speci-
fied by [Sampling Cycle]. Set the interval in units of 0.1 seconds for NT30,
NT30C, NT620S, NT620C, NT625C and 0.5 seconds for the NT21, NT31,
NT31C, NT631, and NT631C.
The latest drawing value of a trend graph can be displayed as a percentage
value.
In the default setting, a percentage value is displayed.
Whether or not a percentage value is displayed can be set with the [Display %]
line property.
Check mark set:
A percentage value is displayed.
Check mark not set:
A percentage value is not displayed.
If the setting is for a percentage value to be displayed, the size and display
position of the value can be modified using the element edit function in the
manner shown below. (For detail of the element edit function, refer to page
110.)
(1) Click on a percentage value while pressing the Shift key and Ctrl key.
(2) Drag a percentage value to change the display position.
Example: Modifying the percentage value display position
(1)
(2)


