Using the Web Browser Interface
Status Reporting Features
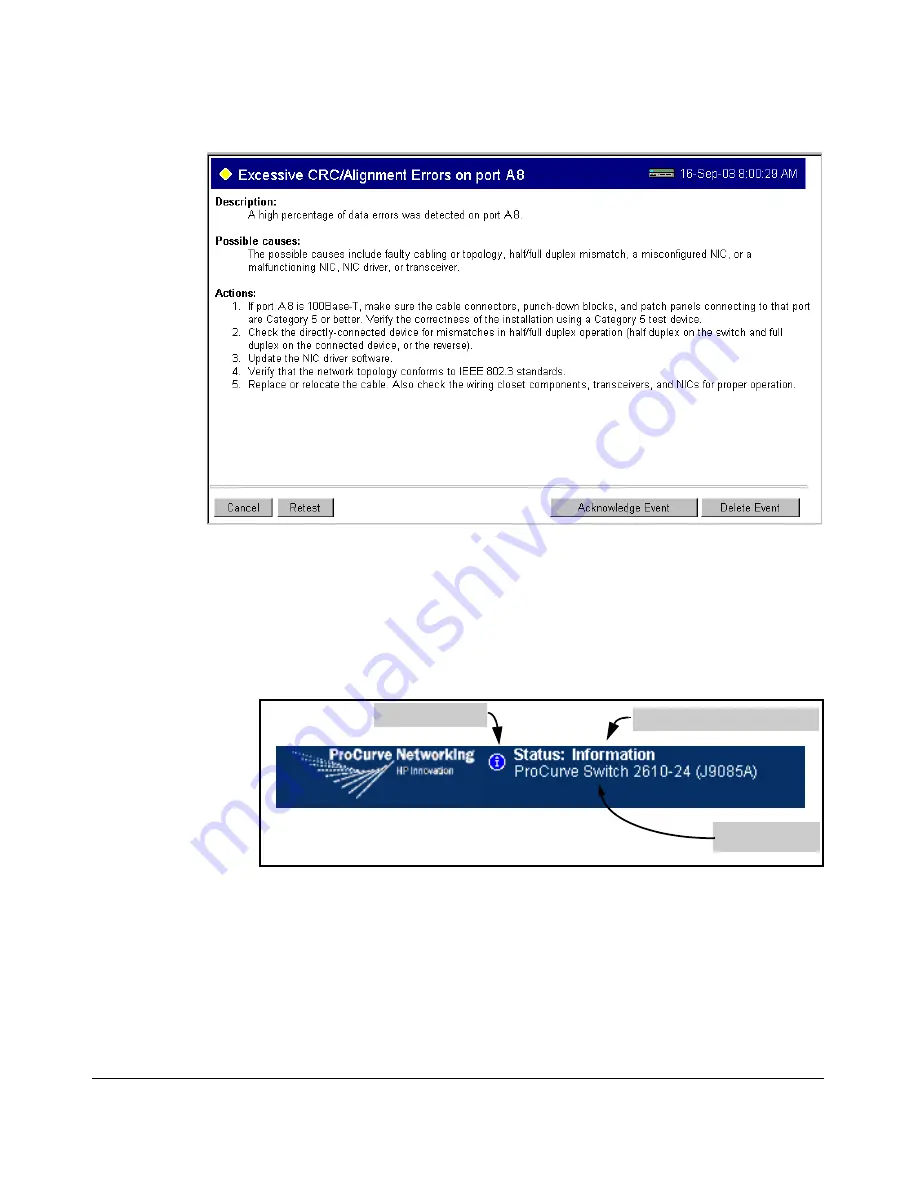
Figure 5-13.Example of Alert Log Detail View
The Status Bar
The Status Bar is displayed in the upper left corner of the web browser
interface screen. Figure 5-14 shows an expanded view of the status bar.
Status Indicator
Most Critical Alert Description
Product Name
Figure 5-14. Example of the Status Bar
The Status bar consists of four objects:
■
Status Indicator.
Indicates, by icon, the severity of the most critical
alert in the current display of the Alert Log. This indicator can be one of
three shapes and colors as shown in the following table.
5-20
Summary of Contents for ProCurve 2610-24
Page 1: ...Management and Configuration Guide 2610 2610 PWR ProCurve Switches R 11 XX www procurve com ...
Page 2: ......
Page 18: ...xvi ...
Page 24: ...Product Documentation xxii ...
Page 54: ...Using the Menu Interface Where To Go From Here 3 16 ...
Page 94: ...Using the Web Browser Interface Status Reporting Features 5 24 ...
Page 132: ...Switch Memory and Configuration Multiple Configuration Files 6 38 ...
Page 148: ...Interface Access and System Information System Information 7 16 ...
Page 192: ...Time Protocols SNTP Messages in the Event Log 9 24 ...
Page 256: ...Power Over Ethernet PoE Operation PoE Event Log Messages 11 18 ...
Page 280: ...Port Trunking Port Status and Configuration 12 24 ...
Page 362: ...File Transfers Copying Diagnostic Data to a Remote Host PC or Unix Workstation A 24 ...
Page 438: ...Troubleshooting Restoring a Flash Image C 48 ...
Page 446: ...MAC Address Management Viewing the MAC Addresses of Connected Devices D 8 ...
Page 450: ...Daylight Savings Time on ProCurve Switches Configuring Daylight Savings Time E 4 ...
Page 462: ...12 Index ...
Page 463: ......


