Using the Web Browser Interface
Status Reporting Features
Status Reporting Features
Browser elements covered in this section include:
■
The Overview window (below)
■
Port utilization and status (page 5-15)
■
The Alert log (page 5-18)
■
The Status bar (page 5-20)
The Overview Window
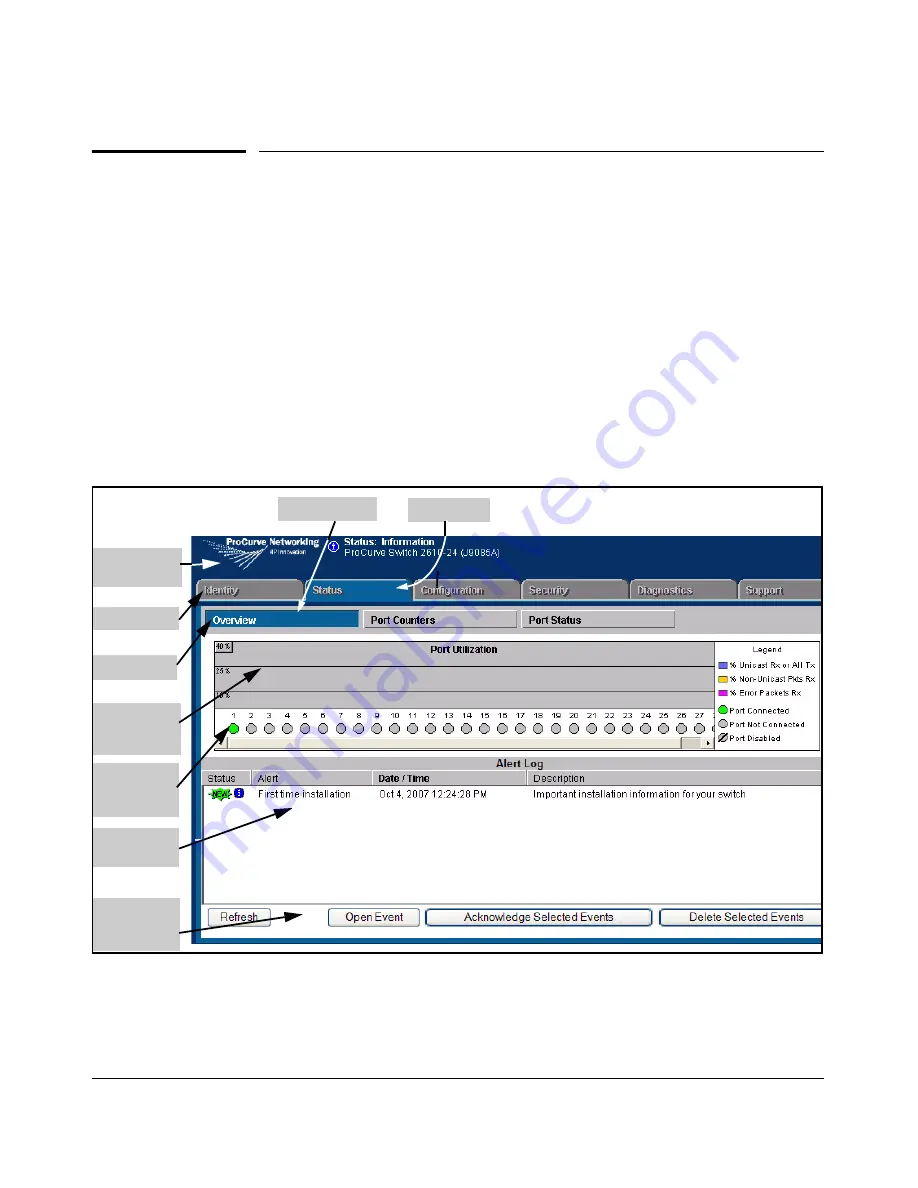
The Overview Window is the home screen for any entry into the web browser
interface.The following figure identifies the various parts of the screen.
Alert Log
Control Bar
Port Utiliza
tion Graphs
(page 5-15)
Active Tab
Alert Log
(page 5-18)
Port Status
Indicators
(page 5-17)
Button Bar
Tab Bar
Status Bar
(page 5-20)
Active Button
Figure 5-7. The Status Overview Window
5-14
Summary of Contents for ProCurve 2610-24
Page 1: ...Management and Configuration Guide 2610 2610 PWR ProCurve Switches R 11 XX www procurve com ...
Page 2: ......
Page 18: ...xvi ...
Page 24: ...Product Documentation xxii ...
Page 54: ...Using the Menu Interface Where To Go From Here 3 16 ...
Page 94: ...Using the Web Browser Interface Status Reporting Features 5 24 ...
Page 132: ...Switch Memory and Configuration Multiple Configuration Files 6 38 ...
Page 148: ...Interface Access and System Information System Information 7 16 ...
Page 192: ...Time Protocols SNTP Messages in the Event Log 9 24 ...
Page 256: ...Power Over Ethernet PoE Operation PoE Event Log Messages 11 18 ...
Page 280: ...Port Trunking Port Status and Configuration 12 24 ...
Page 362: ...File Transfers Copying Diagnostic Data to a Remote Host PC or Unix Workstation A 24 ...
Page 438: ...Troubleshooting Restoring a Flash Image C 48 ...
Page 446: ...MAC Address Management Viewing the MAC Addresses of Connected Devices D 8 ...
Page 450: ...Daylight Savings Time on ProCurve Switches Configuring Daylight Savings Time E 4 ...
Page 462: ...12 Index ...
Page 463: ......


