Monitoring and Analyzing Switch Operation
Port and Static Trunk Monitoring Features
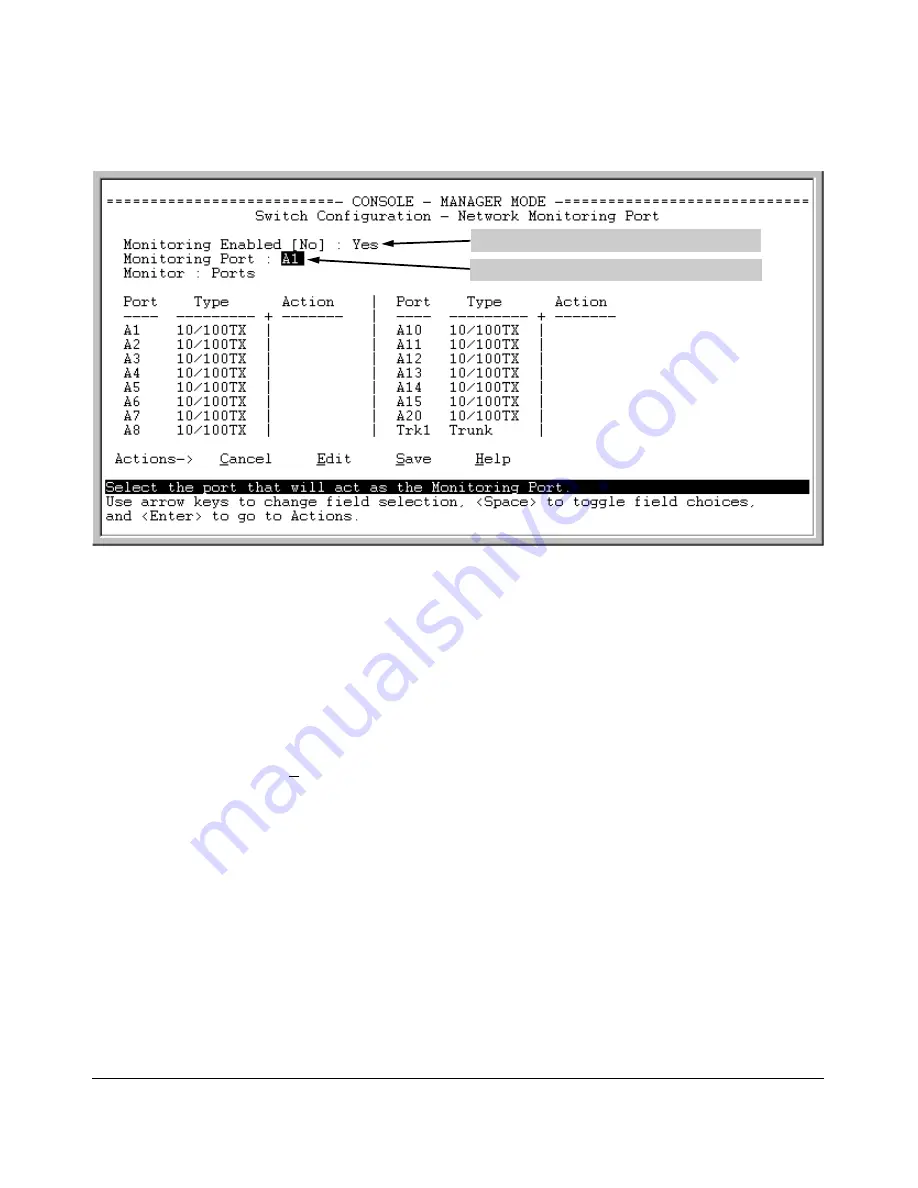
Move the cursor to the Monitoring Port parameter.
Port where monitored traffic exits the switch.
Figure B-20. How To Select a Monitoring Port
5. Use the Space bar to select the port to use for monitoring.
6. Use the down arrow key to move the cursor to the
Action
column for the
individual ports and position the cursor at a port you want to monitor.
7. Press the Space bar to select
Monitor
for each port and trunk that you want
monitored. (Use the down arrow key to move from one interface to the
next in the
Action
column.)
8. When you finish selecting ports to monitor, press
[Enter]
, then press
[S]
(for
Save
) to save your changes and exit from the screen.
9. Return to the Main Menu.
B-25
Summary of Contents for ProCurve 2610-24
Page 1: ...Management and Configuration Guide 2610 2610 PWR ProCurve Switches R 11 XX www procurve com ...
Page 2: ......
Page 18: ...xvi ...
Page 24: ...Product Documentation xxii ...
Page 54: ...Using the Menu Interface Where To Go From Here 3 16 ...
Page 94: ...Using the Web Browser Interface Status Reporting Features 5 24 ...
Page 132: ...Switch Memory and Configuration Multiple Configuration Files 6 38 ...
Page 148: ...Interface Access and System Information System Information 7 16 ...
Page 192: ...Time Protocols SNTP Messages in the Event Log 9 24 ...
Page 256: ...Power Over Ethernet PoE Operation PoE Event Log Messages 11 18 ...
Page 280: ...Port Trunking Port Status and Configuration 12 24 ...
Page 362: ...File Transfers Copying Diagnostic Data to a Remote Host PC or Unix Workstation A 24 ...
Page 438: ...Troubleshooting Restoring a Flash Image C 48 ...
Page 446: ...MAC Address Management Viewing the MAC Addresses of Connected Devices D 8 ...
Page 450: ...Daylight Savings Time on ProCurve Switches Configuring Daylight Savings Time E 4 ...
Page 462: ...12 Index ...
Page 463: ......


