Monitoring and Analyzing Switch Operation
Status and Counters Data
Menu Access to Port and Trunk Statistics
To access this screen from the Main Menu, select:
1. Status and Counters . . .
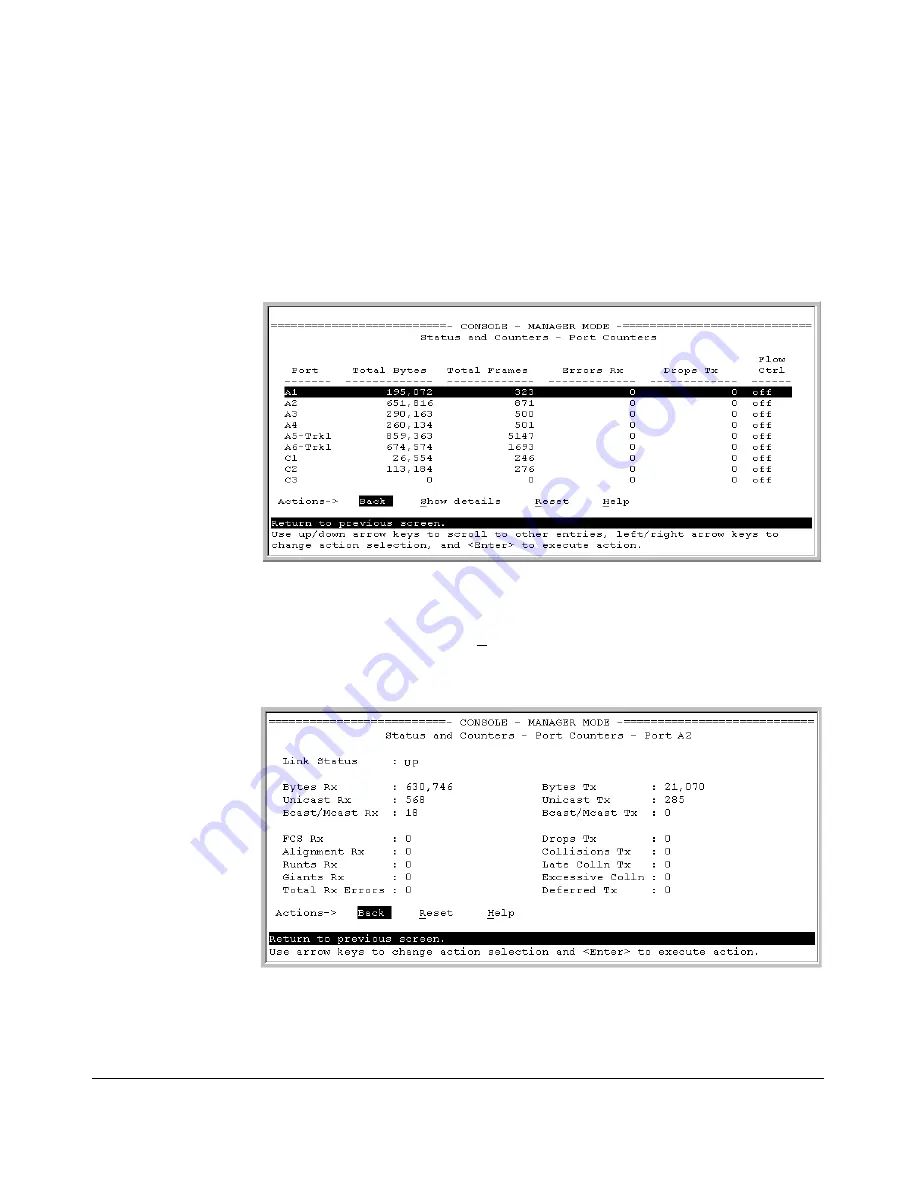
4. Port Counters
Figure B-6. Example of Port Counters on the Menu Interface
To view details about the traffic on a particular port, use the
[v]
key to highlight
that port number, then select
Show Details
. For example, selecting port A2
displays a screen similar to figure B-7, below.
Figure B-7. Example of the Display for Show details on a Selected Port
This screen also includes the
Reset
action for the current session. (See the
“Note on Reset” on page B-10.)
B-11
Summary of Contents for ProCurve 2610-24
Page 1: ...Management and Configuration Guide 2610 2610 PWR ProCurve Switches R 11 XX www procurve com ...
Page 2: ......
Page 18: ...xvi ...
Page 24: ...Product Documentation xxii ...
Page 54: ...Using the Menu Interface Where To Go From Here 3 16 ...
Page 94: ...Using the Web Browser Interface Status Reporting Features 5 24 ...
Page 132: ...Switch Memory and Configuration Multiple Configuration Files 6 38 ...
Page 148: ...Interface Access and System Information System Information 7 16 ...
Page 192: ...Time Protocols SNTP Messages in the Event Log 9 24 ...
Page 256: ...Power Over Ethernet PoE Operation PoE Event Log Messages 11 18 ...
Page 280: ...Port Trunking Port Status and Configuration 12 24 ...
Page 362: ...File Transfers Copying Diagnostic Data to a Remote Host PC or Unix Workstation A 24 ...
Page 438: ...Troubleshooting Restoring a Flash Image C 48 ...
Page 446: ...MAC Address Management Viewing the MAC Addresses of Connected Devices D 8 ...
Page 450: ...Daylight Savings Time on ProCurve Switches Configuring Daylight Savings Time E 4 ...
Page 462: ...12 Index ...
Page 463: ......


