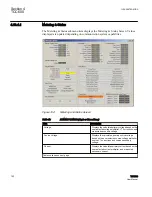


By pointing the mouse to any bar, the corresponding tap statistic will be
highlighted as well as displayed in a tool tip.
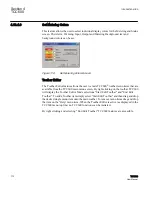
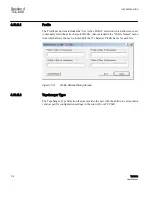
4.10.4.5
Real Time Voltage Chart
The Real Time Voltage Chart feature allows the user to monitor in real time the last 60
seconds of the source voltage value and load voltage. The Voltage Chart freezes the last
30 seconds of the voltage profile and displays the current values.
GUID-9DB711F5-2328-42EE-A564-6C63AD18201A V1 EN
Figure 108:
Real Time Voltage Chart
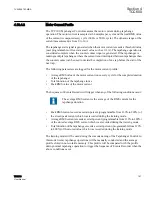
4.10.4.6
Harmonic Analysis
The input signal is sampled at 64 samples per cycle, giving an overall sampling rate of
3840 samples per second for a 60 Hz system. This provides the ability to reproduce signals
of up to 1920 Hz. Therefore, up to the 31st harmonic can be calculated using discrete
Fourier transform with a fundamental frequency of 60 Hz. The fundamental for both the
Voltage and Current channels is calculated every sample meaning, every 260.41 μs. These
Section 4
1VAC388793-MB A
TCC600
166
TCC300
User Manual
Summary of Contents for TCC300
Page 1: ...Digital Tapchanger Control TCC300 User Manual ...
Page 2: ......
Page 3: ...Document ID 1VAC388793 MB Issued 2016 08 10 Revision A Copyright 2016 ABB All rights reserved ...
Page 26: ...20 ...
Page 34: ...28 ...
Page 91: ...1VAC388793 MB A Section 3 Operation TCC300 85 User Manual ...
Page 126: ...120 ...
Page 176: ...Section 4 1VAC388793 MB A TCC600 170 TCC300 User Manual ...
Page 260: ...254 ...
Page 328: ...322 ...
Page 494: ...488 ...
Page 556: ...550 ...
Page 580: ...574 ...
Page 600: ...594 ...
Page 700: ...694 ...
Page 710: ...704 ...
Page 712: ...706 ...
Page 713: ...707 ...
Page 714: ......
Page 715: ......