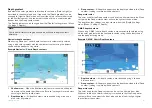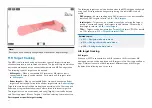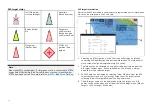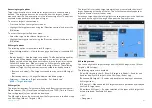
3. Select the
[Waterline to tdcr]
field and enter the distance between the
waterline and the bottom face of your transducer.
4. Select the
[Save to]
field and choose the card reader slot that you inserted
you memory card into.
5. Enable the
[Record depth data]
toggle switch.
6. Select
[OK]
on the notification.
Depth and position data will be logged to the selected memory card slot
whenever a card with sufficient space is inserted. Chart data will not be
overwritten.
Note:
Recording depths is restricted by law in some countries (Sweden, Finland,
Norway, China. Please check online to see if restrictions apply for your
location.
7. Enable the
[RealBathy]
toggle switch.
The bathymetry data will be displayed onscreen in realtime.
8. Select the
[Height correction]
field and choose an option.
•
[None]
— No corrections are made.
•
[Tidal]
— In tidal environments (for example, seas and oceans) select
[Tidal]
and then a list of available stations is displayed, select the
closest tide station to your location.
•
[Lake level]
— In fresh water environments (for example, lakes),
select
[Lake level]
and then enter the current reading from the water
level marker for your location into the field located under the height
correction field.
9. Adjust the
[Visibility:]
setting to the desired transparency.
100% provides full visibility of the RealBathy contours; as the percentage
decreases the chart detail behind the RealBathy contours becomes more
visible.
10. Select the required
[Density:]
setting.
Steep drop-offs can result in overlapping contour lines; lowering the
density in these situations provides a clearer contour.
SonarChart™ Live
You can create personal bathymetry charts using your depth transducer and
the SonarChart™ Live feature, available with compatible Navionics® electronic
cartography cards.
Note:
Before using SonarChart™ Live ensure you have correctly configured
your transducer depth settings.
When using SonarChart™ Live, new contour lines are drawn in real time on
the screen based on your transducer’s depth readings. Color shading is used
to reflect depth, with dark red signifying the shallowest area. The sonar data
is recorded to your cartography card and is shared with Navionics when
you update your chart card online.
Tide correction
SonarChart™ Live records the actual readings from your depth transducer
under current tide / water level conditions. You can enable automatic
adjustment of depth readings based on normalized low tide / low water level
depth data taken from a nearby Tide station.
SonarChart™ Live
Navionics SonarChart™ Live feature allows you to record bathymetry data and
create your own depth contours.. SonarChart™ Live requires compatible
Navionics® electronic cartography. SonarChart Live is available without an
active subscription.
When using the SonarChart™ live feature, new contour lines are drawn in
realtime on the screen based on your transducer’s depth readings. Color
shading is used to reflect contour depths. The bathymetry data is recorded to
your Navionics chart card. Bathymetry data can be uploaded to the Navionics
website so that the contours can be shared.
179
Summary of Contents for LIGHTHOUSE 4
Page 2: ......
Page 4: ......
Page 20: ...APPENDIX C HARDWARE AND SOFTWARE COMPATIBILITY 478 APPENDIX D DOCUMENT CHANGE HISTORY 480 20...
Page 414: ...414...
Page 451: ...4 Select Delete again to confirm 5 Select OK YachtSense ecosystem 451...
Page 484: ......
Page 503: ......


