background image

Chapter 4, Xgig TraceControl Capture Configuration

Capture and Trigger Setup

132

Xgig Analyzer User’s Guide


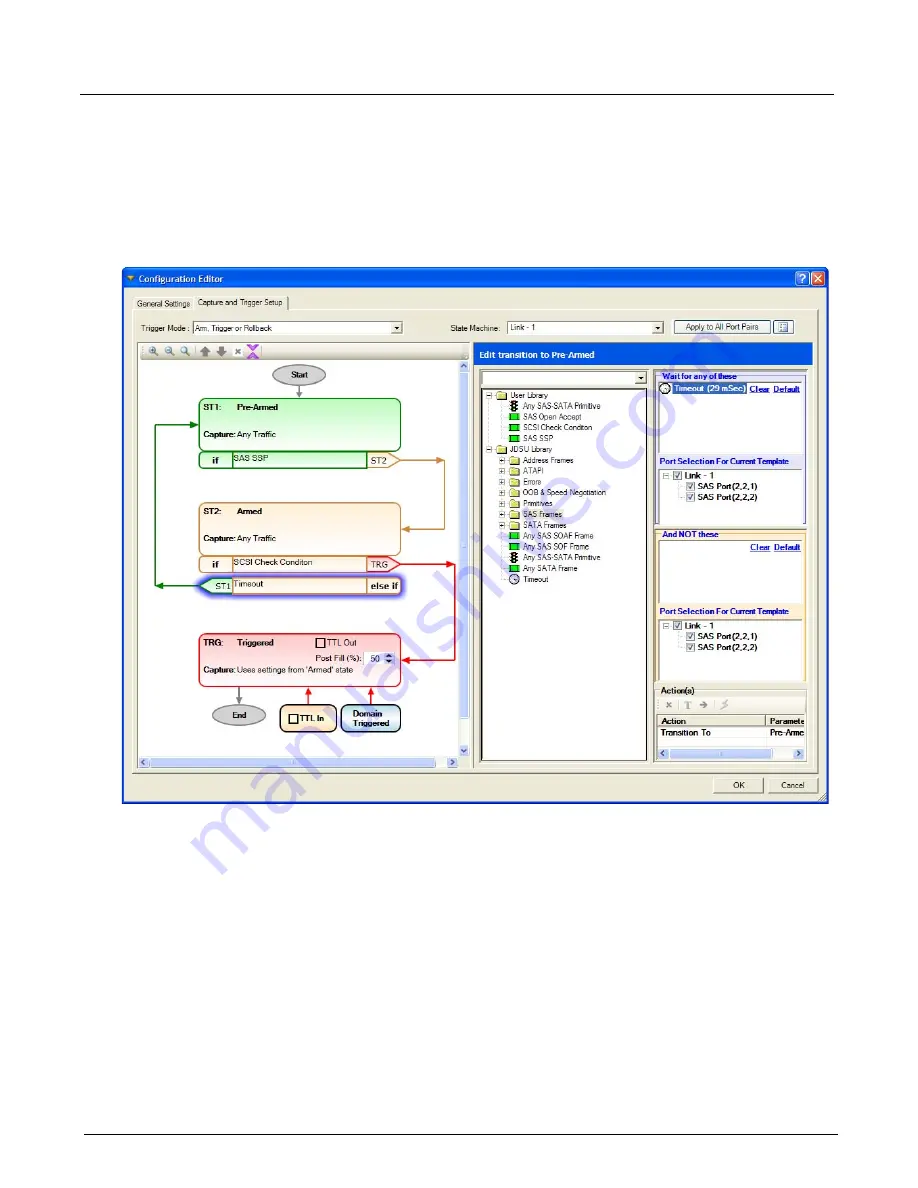
Trigger Within a Window of Time Example

In this example, the analyzer will detect a SAS SSP Command and look for a Check Condition. If 
the Check Condition does not occur within 29 milliseconds after the Command, the analyzer will 
reset to looking for a SAS SSP Command. If a Check Condition does occur before 29 
milliseconds, the analyzer will trigger, fill up the buffer and stop.

Figure 59:  Trigger Within a Window of Time Example

Summary of Contents for Xgig

Page 1: ...Xgig Analyzer Version 7 3 User s Guide ...

Page 2: ......

Page 3: ...Viavi Solutions 1 844 GO VIAVI www viavisolutions com Xgig Analyzer Version 7 3 User s Guide ...

Page 4: ...f this guide may be reproduced or transmitted electronically or otherwise without written permission of the publisher Viavi Solutions and the Viavi logo are trademarks of Viavi Solutions Inc Viavi All other trademarks and registered trademarks are the property of their respective owners Copyright release Reproduction and distribution of this guide is authorized for US Government purposes only Term...

Page 5: ...S PROVIDED BY THE COPYRIGHT HOLDERS AND CONTRIBUTORS AS IS AND ANY EXPRESS OR IMPLIED WARRANTIES INCLUDING BUT NOT LIMITED TO THE IMPLIED WARRANTIES OF MERCHANTABILITY AND FITNESS FOR A PARTICULAR PURPOSE ARE DISCLAIMED IN NO EVENT SHALL THE COPYRIGHT HOLDER OR CONTRIBUTORS BE LIABLE FOR ANY DIRECT INDIRECT INCIDENTAL SPECIAL EXEMPLARY OR CONSEQUENTIAL DAMAGES INCLUDING BUT NOT LIMITED TO PROCUREM...

Page 6: ...Xgig Analyzer User s Guide Page iv Version 7 3 December 2015 ...

Page 7: ...v CONTENTS ...

Page 8: ...ssistance 12 PART TWO Using Xgig TraceControl Chapter 2 About Xgig TraceControl Introduction to TraceControl 16 Chapter 3 Getting Started with Xgig TraceControl Launching Xgig TraceControl 18 Customizing the Menu Bar 18 Secure Login for Xgig Chassis 18 Port Status View 19 Link Status View 26 Capturing Traffic 26 Launching Other Applications 30 Domains Links and Sync Groups 30 Select Ports for Doma...

Page 9: ...urveyor 79 Log Real Time Statistics 81 PCIe Device and Address Mappings 83 Capture PCIe Devices and Addresses 87 TraceControl Options 88 TraceControl Automated Options 90 Configuration Editor 92 General Settings 93 Link Speed 95 Signal Regeneration 99 Traffic Summary 101 Payload Frame Size 101 Number of Segments and Trace Size 102 Scrambling 104 FEC Forward Error Correction 105 CDR Clock Data Reco...

Page 10: ...nitor Launching Xgig Performance Monitor 168 Secure Login for All Xgig Chassis 168 Launching the Application 168 Status Bar Features 169 Selecting the Sync Group 170 Chapter 9 Xgig Performance Monitor Port Configuration Select Ports to Monitor Dialog Box 172 Discover Different Subnets 172 Sync Groups and Domains 173 Port Viewing and Selection 173 Dialog Buttons 174 Setting Cable Lengths for Interc...

Page 11: ...g Box 218 Selecting Chassis Blades Ports and Segments 221 Segment Selection 223 Saving a Trace 223 Chapter 13 Configuring Xgig TraceView TraceView Configuration 228 Saving a Configuration 228 Loading a Configuration 228 Ports Side by Side Configuration 229 Setup Port Groupings 231 Navigating a Trace 234 Using the Find Tab to Set Up Complex Searches 235 Quick Find 236 Search for Marked Locations 24...

Page 12: ...changes View Pane 318 Contents of Exchanges View 319 Navigating in Exchanges View 320 Using the Details Pane 324 Inspector View 324 Dword View 332 LaneView 334 Using the Traffic Summary Pane 336 Traffic Summary SAS SATA Counters 342 Traffic Summary Fibre Channel Counters 355 Using the LTSSM Panes for PCIe 359 Generating LTSSM Data 360 Box Car View 361 Metrics View 362 Flowchart View 363 Chapter 15...

Page 13: ...nd nomenclature 396 Converting I Tech Files 396 Supported I Tech trace file formats 396 Converting I Tech traces 397 Opening traces 397 Converter notes 397 I Tech specific notes 398 Channel mappings and nomenclature 399 Chapter 19 Xgig TraceView Tools Get Information on Decodes 402 Delta Calculator 402 SAS Hashed Address Calculator 402 Copy Event Data Filter on Data Events 403 Export to Text File ...

Page 14: ...gig Expert 426 Opening a Trace 426 Switching to TraceView 427 PART SIX Appendices Appendix A Analyzer File Formats Appendix B Connection and Wiring Examples Example Direct Connection Fibre Channel Network 434 Example Connection Through Taps Fibre Channel Network 435 Appendix C Protocol Display Color Coding Appendix D Xgig Chassis Trigger Stop from the Command Line Requirements 441 Command Line Int...

Page 15: ...1 PART ONE Using Xgig Analyzer ...

Page 16: ...PART ONE Using Xgig Analyzer 2 Xgig Analyzer User s Guide ...

Page 17: ...3 Chapter 1 Introduction In this chapter The Xgig Systems Xgig Blades Connecting the Xgig Analyzer to a Target System Xgig Analysis and Control Software New Features Getting Help ...

Page 18: ...raffic generation Each blade consists of four major elements serial gigabit connection real time performance measurement filter and trigger and capture to memory Xgig blades ensure both accurate data collection and transparency on the link The blade has sophisticated triggering and filtering to isolate error conditions in the data Pre capture filtering can expand the capture time to minutes For de...

Page 19: ...stem as shown in Figure 1 These are Point to point Hub Port Snoop Optical Splitter Snoop Refer to Appendix B Connection and Wiring Examples for examples of the physical wiring for connecting analyzer ports Figure 1 Placing the Analyzer in a Target Network System Device 2 Device 1 Point to Device 2 Device 1 Hub Port Snoop Device 2 Device 1 Optical Splitter Snoop Hub Point Snoop A In A Out B In B Ou...

Page 20: ...t If you cannot interrupt the network and you need maximum versatility for sniffing at different configuration points consider using the Viavi Snoop GBIC or a Viavi Fiber Tap This product provides an additional pair of ports for simultaneous transparent monitoring of either Gigabit Ethernet or Fibre Channel links without causing any link loading or down time of the system under test Xgig Hardware ...

Page 21: ...clicking the chassis name s in the Most Recently Used Chassis section of the dialog Again you must update all the clients and chassis on your network at the same time otherwise the Xgig applications will not see some chassis For sites where Xgig Maestro is not used it is suggested that the DCOM port remain closed Network Address Translation NAT is not supported An Xgig Chassis protected by a firew...

Page 22: ...n vary the update rate to suit your measurement and all meters scale automatically Both the instantaneous average and maximum rates are plotted on the screen Xgig TraceView Xgig TraceView displays the data captured by the analyzer Xgig TraceView will either show data currently in trace memory or open a file containing saved data Xgig TraceView displays traces searches and filters the traces and ex...

Page 23: ...ral factors the size of the trace the number of ports in the trace and the CPU speed and memory capacity of the computer running the Xgig Expert client You can improve performance by manipulating any of these variables Reducing the size of the trace information or reducing the port count in the trace will improve Xgig Expert s performance Increasing the processing power and memory of your client P...

Page 24: ...e 3 Installation requires the removal of older versions of software Remove all older versions of GTX IBT Expert or Xgig software before installing the new version 4 Install the new Xgig Analyzer software on your PC system 5 If the new version requires an upgrade to the Xgig chassis you will receive a separate USB memory drive to upgrade the software on the Xgig chassis Xgig remote analyzer system ...

Page 25: ...ngle and Left angle interposers PCIe Tuning Wizard in TraceControl allowing to change the Equalization settings manually and semi automatically NVMe over ROCE ROCEv2 IBXoE is now decoded when the following TraceView menu is checked View Decode Switches RDMA Payload Interpretation NVMe Protocol TraceView LTSSM Boxcar View lists sequences is visited repeatedly Theay are displayed as a single bubbles...

Page 26: ...models of the Xgig5000 chassis Refer to this document for information on how to install configure upgrade and administer the Xgig5000 chassis The Xgig5000 Blade Hardware Guide provides information on ports LEDs and instructions on how to install or remove the blades for the Xgig5000 chassis The Xgig1000 Hardware Guide explains the hardware and connectors for all models of the Xgig1000 fixed port s...

Page 27: ...13 PART TWO Using Xgig TraceControl ...

Page 28: ...PART TWO Using Xgig TraceControl 14 Xgig Analyzer User s Guide ...

Page 29: ...15 Chapter 2 About Xgig TraceControl In this chapter Introduction to TraceControl ...

Page 30: ...ter use Save captures to disk for analysis Save log of real time statistics Xgig Analyzer software supports the JXgig family of test analysis systems Xgig analyzer software supports up to 64 ports 4 Xgig chassis with 4 blades each blade with 4 ports when concatenating Xgig chassis The maximum number of ports in a domain depends on what types of Xgig Xgig5000 or Xgig1000 systems you have Xgig Analy...

Page 31: ...Getting Started with Xgig TraceControl In this chapter Launching Xgig TraceControl Domains Links and Sync Groups Chassis Upgrade and Maintenance Options PCIe Tuning Wizard 12G SAS Tuning Xgig Tuning and Equalization ...

Page 32: ...ore information on domains See Domains Links and Sync Groups on page 30 Customizing the Menu Bar You can customize the menu bar in TraceControl in several ways Click the arrow icon at the right edge of the menu bar and select either Show or Hide Buttons or Customize Clicking Show or Hide Buttons opens a list of available menu items You can click any of the items icons to show or hide them Clicking...

Page 33: ...Family Hardware Guide the Xgig5000 Family Hardware Guide or the Xgig1000 Hardware Guide for more information on master slaves and sync groups Port Status View The TraceControl main window displays a status of all ports for the current domain If no domain has been created the window is blank When you first open Xgig TraceControl no domains have been created so no domains are shown When you open Xgi...

Page 34: ... as in Performance Monitor If the ports are not locked port LEDs are shown gray See Table 2 for descriptions A tooltip showing the status or errors for a port appears when you curse over the LED F P The color of a software LED light indicates the Frames Packets status for the port The colors have the same meaning as in Performance Monitor If the ports are not locked port LEDs are shown gray See Ta...

Page 35: ...on Recovery CDR loses its lock on the incoming data signal the link speed cell will turn red and display the message CDR Loss of Lock This menu item forces the re locking of the clock to incoming data on the corresponding port If the ports are not locked or capturing this menu will be grayed out For optical 8G blade FC ports if this option fails to re lock the signal clean the fiber optic connecti...

Page 36: ...he link speed will display Out of Band in progress and the background color of the cell will turn into a light blue After the OOB has completed the cell will be yellow You can reset the background color by selecting Reset LED s Link Speed Status and Counters from the View menu When the 16GFC analyzer detects training frames and patterns on the link it displays the message Training in progress in t...

Page 37: ...ll appear in this column B W F P LEDs See the table below for the definition of LED colors for links The LEDs for links are slightly different than for individual ports as it indicates a status for the entire link A tooltip showing the B W or F P status or errors for a link appears when you curse over the LED Table 3 Word and Frame Status LEDs for Links Byte Word LED Reason Gray Ports in link are ...

Page 38: ...ace is ready to be viewed in TraceView If a capture is available the length of the capture will be displayed in the status bar below the menu bar When different ports have different states mixed is displayed Link Speed Shows the link speed for all ports if the link speed is the same If the link speed is not the same for all ports this field displays mixed to indicate mixed data speeds within the l...

Page 39: ...le for each of the four 40G ports in an Xgig1000 chassis Power levels can indicate if signal levels are not strong or have degraded due to the optical electrical optical pass through process when the signal is passed through multiple analyzers or taps SFP diagnostic status fields take some time to show values Allow at least 5 seconds for values to display in these columns especially if you have ma...

Page 40: ... shown in TraceControl s main window is a duplicate of the Link Status panel on the Lane Control tab of TaceControl s Configuration Manager See Lane Control on page 136 for details about the information shown on this panel Figure 7 Link Status View Capturing Traffic To capture traffic and create a trace follow the steps below Starting a Capture Create a domain of ports to use See Creating a New Do...

Page 41: ... Command Line A utility exists to Trigger or Stop captures at the Xgig chassis from the command line of remote clients The domain being triggered stopped needs to be created using TraceControl However the utility does not have to be installed or run on the same machine as TraceControl See Appendix D Xgig Chassis Trigger Stop from the Command Line for complete information Stopping a Capture After s...

Page 42: ...name of the saved trace file s When saving a range of segments the end segment number cannot exceed the number of segments available in the current capture buffer segment configuration If a segment in the specified range does not contain data the segment is not saved An information message will display at the end of the save operation to notify you that some segments were not saved If the option D...

Page 43: ...ved as Surveyor format files Our Surveyor application can be used to open and view the decodes To save the trace in Surveyor format use the Save As type box in the Save As dialog box and select Surveyor Histogram Files hst or Surveyor Capture Files cap as the file type When saving as a cap file TraceControl may save the trace as multiple files More than one cap file is created when the total numbe...

Page 44: ...r icon is hidden by default when you install the client application To display it use the Show Hide feature as described above Domains Links and Sync Groups A Sync Group is a single chassis or multiple chassis that can be time synchronized The Sync Group can be controlled as a single entity through Xgig Analyzer software A Sync Group can be established with multiple analyzer chassis if the chassis...

Page 45: ...rt Configuration can be performed on an entire domain an individual port or a collection of ports Ports within a domain can look for different events to capture and can be set to trigger by different events However all ports within a domain have the same trigger mode and are triggered at the same time by the trigger event Configuration files can only be saved for domains not for individual analyze...

Page 46: ... Select Ports for Domain Creation dialog box of TraceControl for the first time the firewall will prompt you to unblock xgig tracecontrol exe Click Unblock to add xgig tracecontrol exe as a firewall exception to allow the other Sync Groups in the same subnet to be discovered If you are a Standard User you will need the Computer Administrator to unblock xgig tracecontrol exe This also applies to th...

Page 47: ...omains in a Sync Group Each domain within the Sync Group is shown as a hierarchical structure showing all chassis all links and all ports that comprise the Domain The New Domain area lists a domain that is being created without being connected or locked to the hardware Click a port pair in the Port Viewing and Selection area to start the process Only one domain can be created in this area per Trac...

Page 48: ... same chassis are similar to each other for example they are all 1G GE Port Viewing and Selection The dialog box displays an icon for each port arranged as they physically exist within the Xgig chassis To select a port click the port Ports are always selected in pairs so the port and remaining port of the port pair are selected Click ports again to remove them from the domain Selected ports have a...

Page 49: ...will be placed into another single wide link Note The 6 Gigabit SAS SATA Multi Function System Xgig LXP and the 6 Gigabit SAS SATA Multi Function blade each have four ports although eight ports are shown in the chassis view as in the Wide Port 4x blades and the port pairs are arranged in the same pattern as the Wide Port 4x blades The four non operational ports are displayed as blank with a diagon...

Page 50: ...main window to display a status of all ports for the current domain Refresh Updates the status of blades and ports in the right panel and available hosts in the left panel Create Offline Establish the new domain without locking the ports for use This allows you to create a new domain even if the ports included in the domain are locked by another user Create and Lock Exit and establish the new doma...

Page 51: ...sis With Xgig Analyzer started and a USB cable connected from the computer running Xgig Analyzer to the chassis once the Analyzer client detects a chassis connect to the USB port a switch is displayed in the Select Ports for Domain Creation window as shown in Figure 11 Select this switch to turn the USB connection on Figure 11 USB Switch in the Select Ports for Domain Creation Window Note This fea...

Page 52: ...orts on the chassis are locked by another application a message will be displayed asking to unlock all ports before changing the USB mode Refer to Figure 12 to see that once the switch is on 1 and the USB connection has been established with the chassis the connected device icon in the Sync Group s pane of the Select Ports for Domain Creation window changes to reflect that it is connected with the...

Page 53: ... into Ethernet mode Because the Xgig Web Utility is not supported over USB you need to use the Xgig remote administrator Refer to your chassis hardware guide Setting Cable Lengths for Interconnected Chassis You can specify the length of the sync cable s between chassis if you are required to use sync cables other than the ones provided with a chassis Chassis can only sync using straight through RJ...

Page 54: ...red to operate as a Jammer port Jammer ports cannot be selected within TraceControl If you have the proper license you can change the port function to be a Fibre Channel Gigabit Ethernet or SAS SATA Analyzer port BERT Port Indicates that the port is configured to operate as a BERT port BERT ports cannot be selected within TraceControl If you have the proper license you can change the port function...

Page 55: ...lid or missing The port is not usable until a proper license key is entered The licensing for different functions is entered using the Xgig Web Utility See Licensing for Xgig Multi Function Blades on page 44 for more information Xgig Port Selection by Chassis or Blade Ports are displayed within blades and blades are displayed within chassis Port pairs are the unit that is added to the domain selec...

Page 56: ...tab to activate TTL IN Changing Port Functions For Xgig Multi Function Blades except the 6G SAS SATA blade and the 10G blade you can change the function of a port on the blade if you have a license for multiple functions The following functions are currently supported Fibre Channel Analyzer Gigabit Ethernet Analyzer SAS SATA Analyzer PCIe Analyzer Fibre Channel Jammer Gigabit Ethernet Jammer SAS S...

Page 57: ...ad Tester functions at 10 3125 Gbps in the 10 Gigabit Ethernet protocol Analyzer and Load Tester are supported in Analog Passthrough and Digital Retime Jammer is supported in Digital Retime only The SFP ports also support the Analyzer Jammer and Load Tester functions at 4 2500 8 5000 or 14 0250 Gbps in the Fibre Channel protocol in Analog Passthrough or Digital Retime The two QSFP ports support th...

Page 58: ...the blade is moved to a different chassis its blade and port pair licenses and therefore its ability to change functions remains the same In other words the licenses follow the blade and are not associated with the chassis Default Port and Domain Labels Default names are provided for both ports and domains For ports and domains the default name includes a unique port designation in the form X Y Z ...

Page 59: ...the format AA Port X Y Z where AA is function of the blade for example FC for Fibre Channel The function indicator and the chassis blade port indicator cannot be modified You can rename a port by double clicking on the port name or by selecting Rename Port from the Edit menu To return a port name to the default right click the port name and select Set Default Port Name Xgig Port Name Examples FC P...

Page 60: ...l ports on the blade and the two ports together compose a 4x wide link You can only see individual port numbers within the wide link numbered 1 through 8 through Xgig software a single physical port on the blade has no direct correspondence to the single logical port number In the Domain Creation dialog the first port in the left bank is logically associated with the first port in the right bank t...

Page 61: ...Domain A new domain establishes a set of ports for capturing traces Domains must exist in the same Sync Group If you require another domain you can launch another instance of TraceControl and create a domain in that instance Port Numbers 1 3 5 7 1 2 3 4 Blade Number 1 Xgig Chassis Blade Number 2 Port Numbers 2 4 6 8 Blade Numbers 3 and 4 Not Used Ports 1 and 2 form a port pair Xgig or Xgig5000 Cha...

Page 62: ... as a subset of the link in the New Domain area display Duplicate link names are not allowed and the maximum length of a link name is 64 characters 5 Enter the name of the new domain in the Name field at the bottom of the window A default name is supplied 6 Click Create and Lock to connect the domain and load the configuration settings to the hardware Click Create Offline to create the domain and ...

Page 63: ...ork with the same domain Although capture operations continue to run while disconnected from the TraceControl application the ports in the domain are no longer locked for exclusive use Another user can lock the ports and use them for another purpose If your remote analyzer s are in a network environment with many users it is recommended to run captures while connected ensuring that you get the cap...

Page 64: ...connecting using the Start button will cause the analyzer to restart the data capture if the analyzer is already capturing Any data currently within the ports of the domain will be overwritten It is recommended to use the Lock Unlock Ports button to reconnect as this reconnects to the domain without performing any actions c If you are reconnecting to the domain from within the same session of Trac...

Page 65: ...at your local system and then within the network make sure the chassis is physically connected to the network If you can ping the chassis but cannot lock the ports and the ports are not locked by another user as a last resort you may have to reboot the chassis A reboot will result in loss of any capture data within any of the ports on the chassis Chassis Upgrade and Maintenance Options Chassis sof...

Page 66: ...s Firewall must be disabled for the upgrade to happen irrespective of whether you are an Administrator or a Standard User The upgrade process will set up a temporary FTP server and upload the correct system and application files to the chassis The latest system and application files for the chassis were copied to your client during Xgig Analyzer client software installation and these files must be...

Page 67: ...les the FTP server software is disabled and removed from the client When the process is completed click the Refresh or Discover button when the Sync Group is in an operational state Upgrading Chassis that are Not Compatible with the Client If the chassis is incompatible with this version of TraceControl but you can upgrade using the application files on the client the Domain Creation Dialog displa...

Page 68: ...TraceControl If upgrading a Sync Group that has Application Kit software version lower than 3 2 you cannot upgrade the chassis from TraceControl software The Domain Creation Dialog does not display the port selection area for the chassis but instead displays an incompatibility message and a web link to the chassis so you can use the Xgig Web Utility to perform the upgrade ...

Page 69: ... for maintenance or other reasons Right click any chassis in the Domain Creation dialog and use the context menu to select the Shutdown Sync Group option see Figure 19 After clicking on the context menu you are prompted for the chassis administrative user name and password The user name and password entered in the shutdown prompt is applied to all chassis in the Sync Group If there are chassis in ...

Page 70: ...rtant to reboot the DUT every time you change any Interposer Equalization because the equalization affects both the thru path between the host and the target and the tap path towards the Xgig Analyzer Changing the equalization on the thru path changes the link characteristics and the Host Device must be retrained in the Gen3 LTSSM Recovery Equalization phase which happens during reboots Figure 25 ...

Page 71: ...left corner TraceControl automatically captures and triggers on each boot up It stops the capture and processes the trace to determine if the link is good During the tuning process it reports useful information on the host target reports bugs and produces an equalization verdict and grade for each side Figure 27 Tuning Report Tuning a system may require from 10 to more than 500 DUT reboots dependi...

Page 72: ...ful The log will show PERFORMED Reboot capture upon success Redo this test three times in a row to confirm that it works From there you can select this Auto Reboot option in the Tuning Options panel and then hit the Start Auto Tuning button Remote reboot by software This option consists of sending a command over the LAN to reboot the DUT The wizard calls the batch file RemoteReboot bat to do this ...

Page 73: ... Once they work you can select this Auto Reboot option in the Tuning Options panel and then hit the Start Auto Tuning button Mixed IP power remote reboot This is a mix of the two prior options so it requires you to make both of them work before you can use this one This is a last resort option if you find out that repeated short 8 second captures used in Control an IP Power switch are not leading ...

Page 74: ...ld save locally on your PC and on the chassis with the Save To File and the Save to Chassis button Figure 31 Save EQ Settings The wizard automatically saves the best settings in the MY LAST TUNING preset on the chassis and in the TuningWizard folder However it is recommended that you save it again using a meaningful name Newly saved files on the chassis are only available in TraceControl s Lane Co...

Page 75: ...e context menu to open the SAS Link Tuning dialog This option is for 12G SAS only Click Tuning to open the SAS Link Tuning dialog If two blades are being used you must tune each blade independently by launching the SAS Link Tuning dialog twice The new 12G SAS Link Tuning dialog introduces a new concept of port groups It still focuses on the tuning of a single 12G blade but the ports on the blade a...

Page 76: ...select the best preset To automatically select the best preset select Auto select the best preset from the Tunings drop down menu Then click the Apply Changes button The software selects the best preset from the list of saved presets and applies that tuning preset to the hardware This selection is based on the preset with the lowest bit error rate BER When the preset selection is complete a dialog...

Page 77: ...tune all the ports in the configuration loaded on the hardware for the ports you have selected select Auto tune from the Tunings drop down menu Then click the Apply Changes button to begin the auto tuning process Note that when a configuration is selected in the Discovery dialog auto tuning will tune all the ports in that configuration regardless of whether the other ports in the configuration are...

Page 78: ...o tuning process concludes only when the ports are error free for the longest of a series of intervals This may take six hours or more You can stop the auto tuning process at any time and keep the best settings found thus far by clicking the Stop Keep Best button In this case the dialog shown below appears ...

Page 79: ... dialog and returns to the SAS Link Tuning dialog Click the Exit button to close the dialog and return to the TraceControl window Change to preset name To load a preset on the ports in a configuration click Change to preset name from the Tunings drop down list Then click the Apply Changes button The software applies the tuned settings of the preset configuration hardware and returns to the TraceCo...

Page 80: ...ient application could be killed or lose network connectivity while an auto tuning is performed on an Xgig blade In that case the auto tuning will continue running on the chassis until it finishes by itself However the tuning dialog always checks for in progress auto tunings when it comes up and prompts to cancel them ...

Page 81: ...vices and channel in use and maximizes the receiver margin to ensure signal interoperability Always perform Tuning after Equalization settings have changed Tuning can only be performed when the Analyzer ports are in Analog Passthrough mode Digital retiming would initiate an OOB sequence which would cause the user s devices to temporarily stop sending traffic needed by the tuning algorithm Requirem...

Page 82: ...up to 30 seconds During tuning the TraceControl LEDs will flash red while the optimal parameters are determined for the receiver Upon completion of a successful tune the LEDs will turn yellow A page will display showing Tuning has started for the blade ports and the Equalization page automatically returns after a brief period The Tuning result is shown on the Equalization page 6 Manually reset the...

Page 83: ...ion The general rules for choosing the appropriate Equalization setting are listed below The suggested settings for Equalization for each port and speed are provided in Table 4 Note that the legend below Table 4 shows the precise meaning of cable lengths and de emphasis settings at the input device 1 At data rates of 1 5000 Gbps and 3 0000 Gbps the equalization setting can be left to None 2 The Eq...

Page 84: ...high frequencies 6 0000 Gbps Operation Long Cables No De Emphasis Frequency components far from the source may need high equalization as the channel will significantly attenuate high frequencies 6 0000 Gbps Operation Short Cables Low De Emphasis Frequency components close to the source may need low equalization as low de emphasis and cable may cause the channel to mildly attenuate high frequencies...

Page 85: ...e not selected all the ports on the blade to be included in the domain the unselected ports will be grayed out and therefore not configurable in the web page 4 Press the Submit button after the appropriate settings have been selected from the drop down boxes This results in an update on the chassis with your requested settings but does not update the hardware A page will display showing the settin...

Page 86: ...re signal interoperability The copper channel used in SAS SATA consisting of traces vias connectors and cables has low pass filter characteristics This means higher frequency components in the serial bit stream will have their voltage amplitude attenuated in comparison to low frequency components in a pattern To compensate for this phenomenon the SAS 2 specification requires the use of de emphasis...

Page 87: ...rce Device 1 Analyzer Device 1 Signal No De Emphasis Device 1 Signal Received At Analyzer Inside Analyzer with Medium Equalization Example 1 No De Emphasis at Source Device 2 Equalization Applied at Analyzer Exam ple 2 High De Em phasis at Source Device 1 Analyzer Device 2 No Equalization Required at Analyzer Device 1 Signal High De Em phasis Device 1 Signal Received At Analyzer ...

Page 88: ...Note that only 6 0Gbps devices are allowed to have 3M cables and all devices at lower speeds are restricted to 0 5M or possibly 1M Device 1 Analyzer Device 1 Signal No De Emphasis Device 1 Signal Received At Analyzer Through Long Cable Inside Analyzer with High Equalization Example 3 Long Cables from Source Device 2 Equalization Applied at Analyzer 3 Meter Cables ...

Page 89: ...75 Chapter 4 Xgig TraceControl Capture Configuration In this chapter Configure Ports or Domains Configuration Editor General Settings Capture and Trigger Setup Segment Capture Options ...

Page 90: ... TraceControl Configuration Editor Below is an overview of the type of information you can define for an analyzer configuration Size Options Number of Segments Trace Size Frame Length Post Trigger Fill Set the number of buffer segments the trace size per segment the maximum number of bytes in a frame packet to capture and the position of the trigger point within the capture buffer The Number of Se...

Page 91: ...arity of Out of Band Signaling and set other options related to SAS SATA FC or GE captures Clock Sync The clock on the all Xgig chassis is synchronized with your local system by using the Clock Sync operation from the Xgig Web Utility See the Xgig Family Hardware Guide the Xgig5000 Family Hardware Guide or the Xgig1000 Hardware Guide for more information on the Xgig Web Utility Synchronizing the c...

Page 92: ...iguration to TC API To save a TraceControl configuration in a format that can be loaded by the TraceControl API select File Export Configuration to TC API This saves the file with a tccapi extension Files with this extension can be loaded into the TraceControl API For more information about the TraceControl API see the TraceControl API Help system Loading a Configuration Loading a configuration fi...

Page 93: ...f Surveyor is installed on the client computer Xgig TraceControl can convert a GigE capture and launch Surveyor to view the converted capture The picture below shows the TraceControl buttons for launching other applications with the Surveyor button enabled The button is enabled only when Surveyor is installed The button is hidden by default when you first install the client software You must use t...

Page 94: ...ould therefore overwrite previously converted Surveyor captures If the file with the Base File Name for the domain is currently open in the Surveyor application you will not be able to perform another conversion from TraceControl An error message will appear indicating that the file is in use by another application Surveyor Conversion Options in TraceControl Select Tools Options to bring up the di...

Page 95: ...ved how many hours TraceControl will continue to save log files and the csv file delimiter type You can also select which columns to log A separate log file is saved for each port and each link in the current domain in TraceControl To open the Log Real Time Statistics dialog box click the Log Real Time Statistics button in the toolbar or select Tools Log Real Time Statistics from the menu bar Use ...

Page 96: ...soft Excel as another row Options available are once per 1 5 20 or 30 seconds 1 minute or 1 hour Delimiter Delimiters provided are comma semicolon or tab t The delimiter specifies the character s inserted in the csv file to determine the end of a value and the beginning of a new value Delimiters are interpreted by Microsoft Excel when the csv file is imported Comma is the default choice for the de...

Page 97: ...tion for the first port pair listed in the domain The contents of this tab can also be retrieved from any PCIe chassis in the domain Figure 36 Devices And Addresses Dialog When a capture stops TraceControl copies the device mapping from the first domain port into the pre capture devices file for the domain so that every capture s pre capture device file is initialized from TraceControl s domain de...

Page 98: ...the queue not the address of the PRP List itself but all the addresses inside the PRP List There are several optional settings in the dialog that improve expert s analysis annotations and decodes for the capture PCIe Device Vendor ID This combination uniquely identifies a PCIe device worldwide Revision ID Header Type Informational only for this release Expansion ROM Base Size and Additional BARs U...

Page 99: ... the Save button in the Devices And Addresses dialog to save your changes to the device mapping Click the Export To File button to save the mappings to a devices file on the local hard drive for future use Once you export the devices and addresses to a file you can import that file into the Devices and Addresses dialog in the future Exporting Importing Device Mappings To export or import device ma...

Page 100: ...esses copied from the port selected Detecting Insufficient Device Mappings In TraceControl TraceControl s configuration files may contain NVMe specific filters and triggers for example Trigger on a NVMe Write command Each NVMe trigger or filter element needs to be matched in a specific PCIe address range as specified in the Device And Addresses dialog TraceControl resolves the PCIe address range f...

Page 101: ...stage Use the Abort button to end the process Figure 40 Capture PCIe Devices and Addresses Dialog Box The automated Capture PCIe Devices and Addresses process does the following Loads the appropriate configuration file Starts a capture on the current segment Waits for the capture to arm trigger and stop or stops automatically 30 seconds after it is armed Runs Expert on the captured trace Retrieves...

Page 102: ...at your link speed signal regeneration settings are correct If you do not want to see this dialog to double check your settings you can disable the dialog display Select Enable configuration editing during capture if you want to be able to modify configuration files during capture Note that this does not change the configuration for the capture When this option is checked you can save the configur...

Page 103: ...lect the PCIe Errors tab from the Options dialog box to select the specific PCIe errors to be monitored by Port Status View LEDs These options will be gray if there are no PCIe Analyzer ports currently being monitored See Table 14 PCIe Errors on page 204 for a description of all the PCIe errors Check the box for all error types to be included Unselected error types are not used in determining the ...

Page 104: ...llowing trigger modes Stop When Stop Button is Clicked and Advanced with no Triggered state Figure 42 TraceControl Automated Options Autosaving the Capture to a File Check the Save to file after stop with trigger or buffer full option to auto save the capture to a file Use the Browse button to choose a directory location and a file name for the saved file You can restart the capture after the save...

Page 105: ... to control how other applications will behave when capture is stopped If the Save to file after stop with trigger or buffer full option is used the application will process the trace file saved for the capture If the Save to file after stop with trigger or buffer full option is not used the newly launched application will process the contents of the Xgig buffer Launch TraceView after stop Launche...

Page 106: ...window allows you to choose which state machine you want to edit The Apply to all port pairs button applies the current configuration to all port pairs links You can use the Apply to other port pairs button to access a dialog where you can choose other port pairs or links to apply the current capture and trigger settings to Click Apply to apply the current configuration to the selected port pairs ...

Page 107: ...ponding to a link or the whole domain to edit those values The domain and link rows are either blank until you click them or if all ports have the same value that value is displayed Figure 43 Set Value for All Ports in a Domain Not all fields are editable for all ports However all settings for all ports are shown to provide a clear view of all ports in the domain When using mixed ports some column...

Page 108: ...r the whole domain Trace size applies per port Scrambling applies for an FC port pair FEC Forward Error Correction applies per 16G FC or 10GigE port including 40G on Xgig1000 CDR Clock Date Recover applies per 10GigE port pair for 40G Xgig1000 only Transceiver Rate applies per port FCoE CRC Checking applies per port Output Voltage applies per port At the bottom of the General Settings window there...

Page 109: ... cursor in the Link Speed Gbps field 2 Select a rate or Auto For example select the 2 1250 Gbps option from the Link Speed pull down menu in the General Settings tab to set the link speed Gigabit Ethernet Link Speeds The link speed for the Xgig 1G Gigabit Ethernet blade is fixed at 1 2500 Gbps no link speed options will appear for domains with Xgig Gigabit Ethernet ports Using the Xgig5000 10G 8 P...

Page 110: ...re Channel the link speed can be set to the highest rate supported by the blade containing the ports or a supported lower rate Available rates for Xgig Fibre Channel are 1 0625 Gbps 2 1250 Gbps 4 2500 Gbps or 8 5000 Gbps For example the Xgig 2 Gigabit Multi Function blade ports can be set to 1 0625 Gbps or 2 1250 Gbps however higher rates are not supported The Xgig 8 Gigabit Fibre Channel blade fu...

Page 111: ... 5G SATA 3 1 5G and SATA 6 3G For the Auto options no actual negotiation or handshake takes place between the analyzer and any external device the blade ports merely detect the data speed from the speed negotiation sequence happening on the idle link The Auto options can automatically determine the idle link speed only if the Xgig ports see the link initialization activities that take place for ex...

Page 112: ...mpled 2x and 12G traffic is not detected This setting provides flexibility if you do not know whether the data rate of the link under test is 3G or 6G However note that if the traffic is at a 3G data rate then oversampling by 2x may not be ideal If the analyzer shows bit errors then try setting Link Speed to 3G fixed For the Auto options no actual negotiation or handshake takes place between the a...

Page 113: ... Signal Regeneration Mismatch Warning Signal Regeneration Digital signals that are received and passed through the analyzer are weakened very slightly by the optical electrical optical pass through process For most applications the slight reduction in signal strength will not be a factor However for some applications especially where the signal is passed through multiple analyzers the reduction in...

Page 114: ... Tools Options menu to directly set the option for this dialog box See Figure 47 above Multiplexing for SAS SATA Multiplexing is only supported for analog passthrough in SAS SATA To analyze multiplexed signals select the ports that have multiplexed signals and choose the Analog Passthrough Multiplexed option from the Signal Regeneration drop down menu This option is only available for the 6G SAS S...

Page 115: ...Payload Frame Size The Configuration Editor window shows a field to set the length of the payload frame to capture This field allows you to truncate payloads frames Truncating payloads frames can reduce the size of trace when you are not interested in portions of the data This field displays differently depending on the analyzer hardware being used For Fibre Channel the hardware can capture from 0...

Page 116: ...s Buffer segmentation allows you to perform multiple captures within a single capture buffer Time between trigger and restarting capture is minimized allowing you to avoid missing critical events when capturing multiple sections of information See Segment Capture Options on page 139 for information on selecting a segment and segment capture modes The Number of Segments and the Trace Size fields ar...

Page 117: ...f what it would be for non multiplexed ports For example if you select 4 as the value for Number of Segments and the total memory available for a multiplexed port is 2GB the Trace Size value will be set to approximately 245MB note that exact value may vary slightly due to the header size The Number of Segments option sets the number of segments per logical link In the case above you have 4 segment...

Page 118: ...different ports that are part of the same domain Scrambling This setting applies only to the 8G Fibre Channel ports and PCIe ports It allows you to specify whether the capture will include scrambled data For Fibre Channel select the ports and check the Scrambling checkbox to enable scrambling For PCIe ports the Scrambling checkbox is on the Lane Control tab and this setting is enabled by default W...

Page 119: ...omentary errors during the switching process in the downstream data even in Analog Passthrough mode Errors introduced in the switching process can be avoided in Analog Passthrough mode by selecting the Set rate select to High for all speeds The two options available are described below Standard Use industry standard setting Rate select set high for the maximum supported speed by the transceiver an...

Page 120: ...nel over selected full duplex IEEE 802 3 networks Different versions of the protocol have different formats and different specifications for calculating the FCoE s embedded FC CRC value This option allows the Xgig hardware to calculate the FCoE embedded CRC value based on the latest version of the protocol or disable calculation of this value Checking the check box enables selects the latest draft...

Page 121: ...he editors to filter out the data you do not want The overview pane lists all the capture filters and transition settings you have defined for each state or transition Overview Pane The overview pane shows the entire capture as elements arranged in a flow chart It shows the state s of a capture their associated transitions and the flow between the elements All the states are color coded A state an...

Page 122: ...Chapter 4 Xgig TraceControl Capture Configuration Capture and Trigger Setup 108 Xgig Analyzer User s Guide Figure 49 Configuration Editor ...

Page 123: ...ered When creating new states TraceControl copies the capture settings from the state it is coming from into the newly created state In case of a non advanced trigger mode for example going from Stop When Buffer is Full to Arm and Trigger copies the capture settings from the first state to the Armed state The Advanced triggering mode for 6G SAS SATA 12G SAS and PCIe allows you to define additional...

Page 124: ...r in the state bubble as a list If there are more than two items in the list a collapse expand icon appears Click this icon to expand the list If a list of two or more items is collapsed a tooltip containing the names of all the items appears when you curse over the capture section of the state bubble When you click a state or transition bubble a halo appears around it to indicate it is selected T...

Page 125: ... and in doing so would trigger the current capture Post Trigger Fill Post Trigger Fill defines where in the buffer the trigger should be located For example 25 post fill tells the hardware to set the capture window where 3 4 of the buffer contains data that occurred before the trigger and 1 4 contains the data that occurred after the trigger To set the post trigger fill 1 Place the cursor in the P...

Page 126: ...gering you can specify different capture filters for different states The Capture Filter Editor contains two panes Drag templates into the Capture These pane to capture only the events that match any of the conditions in the pane Data will be captured if any one of these conditions are met Drag templates into the But Not These pane to exclude the events that match the all of the conditions in the ...

Page 127: ... to All States First highlight the state with the templates to want to apply and then click the Apply to All States button The capture filters in the selected state are now listed in all states Capture Options A Capture Options tab appears in the Capture Filter Editor for configuring capture options for all protocols The options displayed will be different based on the protocol Some options are gl...

Page 128: ...raining trace This option cannot be enabled if a Training Pattern template is used as a capture filter in any state When you use this option TraceView s Inspector view only displays 32 bits of data per training frame instead of 36 bytes However the decodes in the Interpretation column are the same This option is selected by default Data Compression Mode This option is for PCIe traffic It defines h...

Page 129: ...rce the capture of CRC16 Errors Forces capture of all CRC16 errors Force the capture of LCRC Errors Forces capture of all LCRC errors Force the capture of ECRC Errors Forces capture of all ECRC errors Force the capture of Poisoned TLP Errors Forces capture of all poisoned TLP errors Force the capture of Undefined TLP Type Errors Forces capture of all undefined TLP type errors Force the capture of ...

Page 130: ...educes the capture of random errors This option is checked by default Out Of Band OOB and Speed Negotiation Options The options in this section specify what OOB and speed negotiation data TraceControl should capture The default is to capture all events Possible options are Capture all OOB Speed Negotiation events All OOB and speed negotiation data is captured as well as all other events This is us...

Page 131: ...onnect the fiber Then you will only capture errors after the loss of sync state where this option is in effect to reduce the errors SAS SATA Exclude Options The options in this section specify if certain SAS SATA primitives and errors should always be left out of the capture no matter what is set in the Capture Filter Editor Force capture Code Violation for example means that even if a Frame is se...

Page 132: ...te transitions by using the Available Templates Browser to select pre defined elements Drag templates from the Available Templates Browser into the Wait For Any Of These And NOT These panes to specify the transition from one state to another The And NOT These pane is similar to the Wait For Any Of These pane but the templates dragged here are inverted before they are compared Only 6G SAS SATA 12G ...

Page 133: ...waiting for an event If the time out value is enabled when waiting for an event the analyzer will trigger if the conditions set for the event are met or if the timeout value is reached Note The interface for the Available Templates Browser and the Template Editor are the same for the Capture Filter Editor and Transition Editor in Xgig TraceControl as well as for the search and find operations with...

Page 134: ...on Editor Double click the Timeout icon to set the value When setting a time as the timeout value you can choose the scale nsec usec msec sec for the value from the drop down menu For Dword values type an 8 byte value Only one timeout value can be set per state per port for 6G SAS SATA 12G SAS and PCIe For 16G FC blades at all speeds you can set a timeout on arm and trigger rollback transitions co...

Page 135: ...p by the ports in another link when this transition occurs To use this option select a transition bubble click the Pulse Intra Chassis Signal button in the Actions pane and select either 1 or 2 When the transition occurs in the first link a signal is sent out and picked up by the second link and the two links transition in sync When the Pulse Intra Chassis Signal option is selected for a transitio...

Page 136: ...ps unless the post fill option is set Two state triggers allow you to stop capture based on an event that occurs in the data stream You can select and define the trigger condition in the Transition Editor on the Capture and Trigger Setup tab You may use any or all of the Bit Errors as triggers You can trigger on an ordered set primitive or a frame by highlighting the Pre Triggered state s transiti...

Page 137: ...hat causes the Xgig Analyzer to go back to waiting for an Arm condition if the selected rollback event occurs You can use the Timeout template to specify a time out value for the Trigger or the Rollback Condition You can use the Timer template for the Trigger or the Rollback but not both You can select and define trigger or rollback conditions You may use any or all of the Bit Errors as triggers Y...

Page 138: ...annel Protocol FCP traffic The default setting for the Pre Armed and Armed states is to capture Any Traffic The port pair continues to capture data until the trigger condition is met When the trigger event of Any Error found by HW is seen in the data stream all ports in the domain continue to capture until 50 of the buffer is filled with post trigger data and then all ports stop The percentage of ...

Page 139: ...ion is met If the trigger event of Write Command is encountered in the data stream all ports in the domain continue capture 50 more of the trace size and then all ports stop If the timeout of 28 sec is reached the state rolls back to the Pre Armed state The percentage of the buffer containing data immediately after the Trigger event is controlled by the Post Trigger Fill setting on the Capture and...

Page 140: ...gurations with multiple levels You can create states and define capture filters and transitions including rollbacks triggers or transitions to other states When the Advanced trigger mode is selected the Overview pane shows a single state and its transition For Advanced triggering mode you can define up to 16 states including the trigger for 6G SAS SATA and 12G SAS and up to eight states including ...

Page 141: ...ew state is a different color as are its transition bubble and transition line This helps you distinguish it from other states Each state can have a trigger and up to three transitions to other states To define a transition from one state to another follow these steps 1 Click the transition bubble of the state you want to transition from 2 In the Actions pane click ...

Page 142: ...If the state is above the current state then the transition line is on the left Otherwise the transition line is on the right Once you define a transition to another state for the transition labeled if a new transition bubble named else if appears A new else if transition bubble appears each time you define a transition to another state until you reach the maximum per state of one trigger and thre...

Page 143: ...ways the first transition for a state for 6G SAS SATA and 12G SAS If you want to zoom in or out use the zoom and fit to window buttons To delete an entire state from the configuration use the delete icon in the menu bar Note that this icon is different from the delete icon in the Actions pane which deletes only the assigned action from a transition To collapse or expand all the template names in t...

Page 144: ...hese steps 1 Select Trigger from the Trigger Mode drop down menu This two state trigger includes Pre Triggered and Triggered states 2 Define the trigger event in the Transition Editor 3 Select the post trigger fill level you want The default is 50 4 Select Start Capture on All Segments from Selected to Last from the Segment select drop down menu in the TraceControl main window To continue to wrap ...

Page 145: ...re if the trigger event occurs within some time interval after the arm condition See Time out Value on page 119 for information on time out options Trigger on Time out Example In this example the analyzer will detect an SAS SOAF frame and wait for an Open Reject or an Open Accept If neither response occurs within 20 sec the analyzer will trigger fill up the buffer and stop If an Open Reject or an ...

Page 146: ...e analyzer will detect a SAS SSP Command and look for a Check Condition If the Check Condition does not occur within 29 milliseconds after the Command the analyzer will reset to looking for a SAS SSP Command If a Check Condition does occur before 29 milliseconds the analyzer will trigger fill up the buffer and stop Figure 59 Trigger Within a Window of Time Example ...

Page 147: ...d Trigger Setup tab To define values for a setting for the ports in link or domain simultaneously select the link or domain field for that setting column in the General Settings tab of the Configuration Editor and choose the value That value is now applied to all applicable ports for that field Fields for ports for which the value does not apply are grayed out For example in a mixed port domain of...

Page 148: ...rors such as CRC errors Loss of Signal Errors code violations and disparity errors Use one of the configuration file templates listed above to set a trigger on all SCSI errors Triggering Across Devices The Xgig Analyzer can be triggered by or can trigger an external device Trigger in and out is performed through the TTL ports BNC and MCX Trigger Connections All Xgig chassis have a TTL Input and a ...

Page 149: ...use the analyzer to send a pulse through the TTL Output port when the trigger condition for the analyzer is met See Select TTL Out on page 42 for information on using the Domain Creation dialog box to set up the TTL Output pulse Xgig as the Input Device To trigger the analyzer on TTL Input check the TTL In check box outside the trigger state bubble See Select TTL In on page 42 for information on u...

Page 150: ...gs The bottom panel labeled Link Status shows a real time status of the link and lanes Figure 61 Lane Control Tab The top panel displays the port pair configuration controls side by side If there are more than one port pairs in the domain they are shown below and a vertical scroll bar appears Above the port controls there are three buttons and two check boxes With the exception of the Reset to Def...

Page 151: ...tate Transitions on page 116 The Scrambling checkbox allows you to specify whether the capture will include scrambled data This option is enabled by default The Interposer Lane Enable checkboxes allow shutting down physical lanes when unchecked This feature is required in order to allow the chassis to interoperate with x1 x2 or x4 PCIe cards installed in the interposer The motherboard will see all...

Page 152: ...bottom panel shows the Link Status view This panel is shown in the Lane Control tab and in the Port Status view in Trace Control s main window This panel displays the real time status of the link and lanes currently detected by the hardware The top table shows the status related to the link Speed Width Number and Status The Status LED is the same as the B W LED in the Port Status view The LED disp...

Page 153: ...applications TraceView Expert or Surveyor will be grayed out if the current segment does not contain a valid trace Also the capture time in the status bar indicates the capture time for the current segment not the capture time for all segments Segment Capture Mode Different start modes are available when using buffer segmentation The modes are selected from a drop down box next to the Start button...

Page 154: ...o the last segment Note that the Start Capture on All Segments from Selected to Last mode is not valid when you are in a trigger mode that requires the stop button to be pushed Stop When Stop Button is Clicked No trigger For this condition the capture is started in the selected segment and you MUST click the Stop button to stop the capture and the Stop button will also stop the sequence of capture...

Page 155: ...urs taking a trace only to see later that the error captured has nothing to do with the LOS issue you are trying to correct One way to work towards finding the LOS issue would be to segment the buffer Now you can automatically take several traces over a prolonged period of time for coding disparity errors If one of the traces does not demonstrate the LOS condition you are looking for the next trac...

Page 156: ...Chapter 4 Xgig TraceControl Capture Configuration Segment Capture Options 142 Xgig Analyzer User s Guide ...

Page 157: ...143 Chapter 5 Template Browser Template Editor In this chapter Template Browser Template Editor ...

Page 158: ... apply to SAS SATA ports will display in the Available Templates Browser There are templates that are a set of underlying frames primitives errors instead of a single frame primitive error These template names start with the word any Any SAS SATA Primitive refers to all primitives within the SAS and SATA protocols For example Any SAS Broadcast refers to any of the SAS broadcast primitives as there...

Page 159: ...ed by the user They can be identical to the pre defined templates available in the Viavi Library The User Library section can store the templates you use most often identified by names you create You can define unique templates that are not available in the Viavi Library User defined templates are typically created using a pre defined template as a starting point Add the values patterns and qualif...

Page 160: ...n easier method of including addresses and ports in a template for Ethernet frames This editor is launched automatically when you double click the LAN Conversation template which is only available when using GigE ports After you have made all your selections to create the new template press OK It is suggested that you always rename a new template you create You can store your new template in any l...

Page 161: ...ed set FC or GigE select the type from the pull down menu You can also enter hex values or Xs for don t care bits directly into the fields Bit Pattern Definitions Bit level definitions are possible by double clicking on a byte within a template for a frame which brings up the Binary Editor Click the bit in the Binary Editor type in the new value and click OK Primitives To change the hex values of ...

Page 162: ...e 64 shows in place editing for an IP address The context menu displays when you right click a node in the Tree View The menu contains some or all of the following options depending on the current item selected Edit This menu item is only available on editable fields Select Edit to directly edit the field value in Tree View the area on the right in the display The field format can be hexadecimal d...

Page 163: ...pport a 64 bit search pattern at all speeds This tab is only available for Frame templates in the Wait for any of these pane in the Capture Filter Editor You can select to search anywhere in a frame or to search within a range of words for a specific hex or ASCII pattern You can either type a value directly in the hex pattern or double click a value to open the binary editor To define an ASCII pat...

Page 164: ...s triggering on specific lanes for OS and Error templates The Template Editor s Options tab displays the lane selection boxes By default all lanes are selected Although this feature is enabled for all errors it is useful only for these following errors Bad Sync Header Loss of Sync Header Lock Disparity Code Violation LOS OS Errors Unknown OS and Logical Idle Errors ...

Page 165: ...he offsets on the left Bit Pattern Definitions Bit level definitions for any byte can be specified Select a byte within a template displayed in the template editor and press the Set Bit Pattern button to bring up the bit level pattern editor The bit level pattern editor is a selection box for describing a bit pattern for the selected byte within the template Add Conversations The area below the by...

Page 166: ... down box to specify if the column and row headers display in decimal or hexadecimal Note that although you can display the data in different formats all formats use a byte boundary Only byte quantities can be entered or displayed Any specific value you create for templates can have don t care values For example assume you re only looking for FFFF34 in the first three bytes of the MAC destination ...

Page 167: ...and 1 in offset 37 This sets the selection to both the source and the destination port If a port number is a decimal value less than 256 then the value of the first byte of the port number is zero and the second byte is the decimal port number For example for HTTP port 80 enter zero in offset 34 and 80 in offset 35 The byte boundary restriction applies to any other decimal number such as a number ...

Page 168: ...tion Frame Editor dialog box with the bit pattern indicator is shown below If a bit level filter contains all X in either its left portion first 4 bits or right portion last 4 bits and the Data format selected is HEX it will be displayed in Current Template Display area as X suffixed or prefixed with the hex value of the other portion For example if you enter bit pattern XXXX 0101 it will be displ...

Page 169: ...ted Station Address field The station address types are described below FCoE address 6 hexadecimal digits For example 5A0009 MAC address 12 hexadecimal digits For example 34FD34AA0001 Table 6 Defining Conversations Conversation Element Description Protocol FCoE MAC IPv4 IPv6 IPX or Atalk AppleTalk Frame Type EV2 Ethernet II SNAP 8022 IEEE 802 2 8023 IEEE 802 3 ISL Q EV2 Q SNAP Q 8022 Q 8023 and IS...

Page 170: ... IPv4 address are shown below 0 0 0 0 0 0 192 168 0 1 or 192 168 0 1 IPv4 mapped IPv6 addresses are shown below 0 0 0 0 0 FFFF 192 168 0 1 or FFFF 192 168 0 1 If no value is entered for a Station Address field all stations are selected For example if you set an address for Station 1 no address for Station 2 and set the direction to all packets having Station 1 as the Source Address are selected fo...

Page 171: ...emplate check box Refer to the table below for field definitions that comprise a port number selection Protocol and Frame Type The protocol and the frame type are selected from pull down boxes Xgig TraceControl automatically restricts you from entering combinations that make no sense Port Number Port numbers can be entered in decimal directly into the Port Number field Traffic Direction Indicator ...

Page 172: ...emplate Editor 158 Xgig Analyzer User s Guide Apply Port to Template Check Box To apply the port to your template make sure that the Apply port to template check box is selected Enabling the port will modify the data patterns used in the template ...

Page 173: ...159 Chapter 6 Xgig TraceControl Hints and Tips In this chapter TraceControl Hints and Tips Keyboard Shortcuts ...

Page 174: ...nce Monitor application Set up buffer segmentation to capture multiple captures in the same memory buffer Once started the remote chassis will continue to run if you lose the connection or exit the TraceControl application However the ports in the domain are no longer locked for exclusive use Reconnect to domains using the Lock button Trigger Highlight a transition bubble to access the Transition ...

Page 175: ...l Key Description Ctrl O Load Configuration Ctrl S Save Configuration F3 Apply Configuration to Hardware F5 Go to Performance Monitor F7 Start Capture F8 End Capture F9 Go to Expert F10 Go to TraceView F11 Go to Surveyor For User Defined Templates Only Ctrl O Open Ctrl C Copy Ctrl X Cut Ctrl V Paste Ctrl D Go to Create Domain dialog Del Delete F2 Rename F1 Help ...

Page 176: ...Chapter 6 Xgig TraceControl Hints and Tips Keyboard Shortcuts 162 Xgig Analyzer User s Guide ...

Page 177: ...163 PART THREE Using Xgig Performance Monitor ...

Page 178: ...PART THREE Using Xgig Performance Monitor 164 Xgig Analyzer User s Guide ...

Page 179: ...165 Chapter 7 About Xgig Performance Monitor In this chapter Introducing Xgig Performance Monitor ...

Page 180: ...e data transfer rate in megabytes data transfer rates in kiloframes utilization percentage frame statistics frame errors SAS SATA error counters PCIe errors and physical errors Meter View Presents the current transfer rate and a metered representation of the transfer rate LED View Indicates the current status of all ports Summary of Status LEDs LED Summary View Indicates the summary status of all ...

Page 181: ...167 Chapter 8 Getting Started with Xgig Performance Monitor In this chapter Launching Xgig Performance Monitor ...

Page 182: ...is in the sync group If the master has authentication turned off and a slave s has authentication turned on then the sync group as a whole has authentication turned off The settings for the master chassis also prevail for the password the password of the master chassis will be the password for any slave chassis in the same Sync Group See Xgig Blade and Port Numbering on page 45 and the Xgig Family...

Page 183: ...itor Status Bar Features The status bar at the bottom of the window shows the errors currently seen on the network SOF if frame traffic is flowing and the total monitor time List of Error Counters Displayed All the errors currently seen on the network are listed in the status bar Total Monitor Time The total running time of the current monitor session is displayed as the Total Monitor Time If Perf...

Page 184: ...k connection To Select a Host 1 Press the Select Sync Group button or select Select Sync Group from the Hardware menu The Select Ports To Monitor dialog box appears All Sync Groups within the local area subnet including your local machine if applicable are displayed in the window on the left 2 Select the Sync Group containing the hardware ports you want to view If the hardware you wish to access i...

Page 185: ...171 Chapter 9 Xgig Performance Monitor Port Configuration In this chapter Select Ports to Monitor Dialog Box Chassis Upgrade and Maintenance Options Changing Port Functions ...

Page 186: ...ility and status of ports It also allows you to discover Sync Groups on different subnets or flash the LEDs of ports on any Xgig chassis Sync Groups can consist of multiple cascaded Xgig chassis Figure 70 Select Ports to Monitor Dialog Box Discover Different Subnets To select Sync Groups on a different subnet enter the IP Address or DNS name in the Address field and press Discover top of the dialo...

Page 187: ...c Group the name and address of the master chassis within the Sync Group displays in the Sync Group s area The IP address of slave chassis cascaded to the master will not be shown in the Sync Group s area However you can use the name or address of a slave chassis in the Address field described earlier to discover a Sync Group on a subnet The Sync Group Domain s area lists all the domains in the Sy...

Page 188: ...function of ports When selecting ports to monitor in Performance Monitor you cannot explicitly create links You can select either ports or a domain to monitor When Performance Monitor is launched from TraceControl any defined links in TraceControl s domain will be shown Ports viewed in Performance Monitor that are chosen by selecting a domain from the domains tree will be shown with any defined li...

Page 189: ...tication is enabled you must provide the Xgig password prior to setting the cable length Providing the proper sync cable length s is essential to ensure that the captures are properly time aligned Chassis Upgrade and Maintenance Options Chassis software upgrade and chassis shut down are available from the Select Ports to Monitor dialog box of Performance Monitor Right click a chassis and select th...

Page 190: ...mmer Generator Target Emulator Delay Emulator or Load Tester function will display but they must be changed to an Analyzer function before Performance Monitor can use them Xgig ports with another function can be changed to an Analyzer function if the port is not locked by another user and the blade has the proper license To change a blade port function 1 Select the port you want to change by click...

Page 191: ...l not be available For all Xgig blades there is a blade license key and if required a license key for each port pair The port pair license key allows specific functions for each port pair The port pair license is only assigned if port pairs within the blade are licensed for different functions If all port pairs on the blade have the same functions only the blade license key is assigned and used Th...

Page 192: ...Chapter 9 Xgig Performance Monitor Port Configuration Changing Port Functions 178 Xgig Analyzer User s Guide ...

Page 193: ...179 Chapter 10 Xgig Performance Monitor Configuration In this chapter Monitor Views Hardware options Performance Monitor Options Toolbar Functions ...

Page 194: ...u choose ports from the Select Ports to Monitor dialog box and press OK the Resource Browser lists the chassis and ports you have selected and Performance Monitor begins the monitoring process If you have selected more than 32 ports Performance Monitor begins monitoring only the first 32 ports however all selected ports will display in the Resource Browser When launching Performance Monitor from t...

Page 195: ...lected analyzer ports and links Rates are expressed in Mbytes sec and Kframes sec A Total line graph is displayed also depending on the selection from the Resource Browser When the Frame Type in the Preferences dialog is set to SCSI Frames the Chart View displays transfer rates in SCSI Mbytes sec frames with RCtl 0x01 and Type 0x08 and SCSI Kilo Commands per second frames with RCtl 0x06 and Type 0...

Page 196: ...ation option See Utilization Display Option on page 205 Snapshots of all data over time can be logged in csv files see Statistics Logging Function on page 207 When the Frame Type tab of the Preferences dialog is set to SCSI Frames the Meter View will display SCSI Megabytes per second and SCSI Kilo Commands per second This option is available for 1 2 4 8G Fibre Channel ports only An example of Mete...

Page 197: ...mum and current rate values are available The tabs within list view are described below Right click List View to bring up a menu of configuration options See Preferences on page 193 for information on configuration options and a detailed description of the counters shown in List View Snapshots of all data over time can be logged in csv files see Statistics Logging Function on page 207 To reset all...

Page 198: ...ab The Frame Stats tab shows a running count per port for common Ethernet frame types Counts are listed for Gigabit Ethernet ports only This tab displays in List View only if the current domain contains any Gigabit Ethernet analyzer ports Frame types counted are Multicast Frames Broadcast Frames Unicast Frames Undersized Frames Oversized Frames VLAN Frames iSCSI Frames Frame Errors Tab The Frame E...

Page 199: ...g5000 and Xgig1000 ports columns for unselected physical error types as configured within the Phy Errors tab of the Preference dialog are not shown in the Phy Errors tab of List View For example if Code Violation errors are not selected the Code Violation Errors column is not shown For state errors such as loss of signal or loss of sync the current state will appear in the Traffic Status column SA...

Page 200: ...S Errors Gen 3 LOS Errors CRC16 Errors LCRC Errors ECRC Errors Poisoned TLP Errors Undef TLP Type Errors Invalid H0 TLP Length Errors Msg Violation Errors PAD Req Violation Errors Frame Length End Errors Misaligned SOP Errors Bad Sync Header Errors EDS then Data Block Errors EDS then Wrong OS Errors SDS then OS Errors No EDS before OS Errors Frame Block Errors Bad STP Errors Invalid STP TLP Length...

Page 201: ... within the Frame Errors tab the Phy Errors tab and the SAS SATA Errors tab of the Preferences dialog box are not used in determining the value of a status LED for a port For example if CRC errors are not selected and the only errors discovered for a port are CRC errors the status light for that port will remain green The LED will stay red if the error condition persists If the error condition sto...

Page 202: ...ly disconnected from the network Use the Resource Browser to see the status of individual ports All ports in the Sync Group are summarized in the LED Summary View regardless of what ports are actually selected in the Resource Browser for other monitoring views The number of ports that have the status indicated by the color of Status LED are shown inside each LED There are two rows of LEDs one for ...

Page 203: ... retimed or set for analog passthrough Select Port Settings from the Hardware menu to set these options when the ports are not locked by the TraceControl application The Link Speed and Signal Regeneration Settings dialog box appears showing all ports monitored The settings that display initially are those currently set for each hardware port For FC ports set to 4 2500 or 8 5000 Gbps Scrambling set...

Page 204: ...and speed negotiation events If link initialization sequence does not happen while an Auto option is set the blade will retain its existing speed For example select the 1 5000 Gbps option for the Link Speed in the TraceControl Configuration window to set the link speed to 1 5000 Gbps Then select the Auto SAS 6 3 1 5G SATA 3 1 5G option for the Link Speed If no link initialization happens the speed...

Page 205: ... This setting applies only to the 8G Fibre Channel ports and PCIe ports However the scrambling setting for PCIe ports is on the Lane Control tab in TraceControl not on the General Setting tab See Lane Control on page 136 for instructions on using the Scrambling setting on the Lane Control tab This setting allows you to specify whether the capture will include scrambled data Select Fibre Channel po...

Page 206: ...e lock to Incoming Data This option only appears when an 8G blade FC port or 6G blade SAS SATA port is being monitored When the Clock Detection Recovery CDR loses its lock on the incoming data signal the link speed cell will turn red and display the message CDR Loss of Lock This menu item forces the re locking of the clock to incoming data on the corresponding port If the ports are not locked or c...

Page 207: ...lso right click in any view and select Preferences from the menu Color Preferences Change the colors of the port names by double clicking on the port name in the list on the left A dialog box will display to select a new color for the port display The background of the strip chart can also be changed by pressing the Edit button When you change the background color of strip chart the strip chart co...

Page 208: ...he Update Rate tab to set the refresh rate for all monitor views Choose the rate from the Update Rate pull down menu The default is to update all views every 1000ms This tab also has a checkbox that when checked will display a warning after a Traffic Summary has occurred This is for SAS ports only Figure 80 Update Rate Preference ...

Page 209: ... To view all frames click the All Frames radio button The FC SCSI Frames option applies to 1 2 4 8G Fibre Channel analyzer ports only When this option is selected the frame counter in KFrames sec counts the SCSI Command frames only frames with RCtl 0x06 and Type 0x08 The throughput in MB sec is calculated based on SCSI Data frames RCtl 0x01 and Type 0x08 This option will be gray if there are no Fi...

Page 210: ...tor Options 196 Xgig Analyzer User s Guide List View Select the List View tab from the Preferences dialog box to hide or view certain columns in List View Columns that can be displayed hidden are Port Type Link Speed Signal Regeneration Figure 82 List View Preferences ...

Page 211: ...nition of the frame counters Table 10 GE Frame Counters Error Counter 1GigE Ports 10GigE Ports Description Mulitcast Frames YES YES Count of all Ethernet multicast frames Broadcast Frames YES YES Count of all Ethernet broadcast frames Unicast Frames YES YES Count of all Ethernet unicast frames Undersized Frames YES YES The total number of packets received that were shorter than 64 octets and were ...

Page 212: ...e Errors tab from the Preferences dialog box to hide or view specific frame errors in List View Jabbers and Fragmented Frame error counters will be gray if no Gigabit Ethernet port is being monitored The FCoE Embedded CRC error counter will be grayed out if no 10G port supporting FCoE is being monitored Figure 84 Frame Error Preferences ...

Page 213: ... octets inclusive but had either a bad FCS with an integral number of octets FCS CRC Error or a bad FCS with a non integral number of octets Alignment Error For FC or SAS SATA checksum of encoded bits does not match the CRC value FCoE Embedded CRC NO YES NO NO For FCoE the total number of packets received where the checksum of encoded bits does not match the embedded CRC value Jabbers YES YES NO N...

Page 214: ... errors detected for a port are CV errors the status light for that port will remain green Loss of Sync LOS errors are only available for PCIe ports For Xgig ports columns for each selected error type that can be counted are displayed in List View For Xgig ports columns for unselected error types are not shown For example if CV errors are not selected the CV Errors column will not display For stat...

Page 215: ...n an 8B 10B encoded block O Code Errors OC NO NO YES YES NO The 4 bit O code in a 64B 66B encoded block contains an illegal value Control Character Errors CC NO NO YES YES NO Any control character in a 64B 66B encoded block contains an illegal value Sync Error SY NO NO YES YES NO The Sync Field in a 64B 66B encoded block has an illegal value the first two bits of the block have a bit value of 00 o...

Page 216: ...des a brief definition of the error type Note that Primitive Sequence Errors do not increment the Any Errors counter regardless of which options are set Table 13 SAS SATA Error Counters SAS SATA Error Counter Description Framing Errors FE This counter increments when any of the following conditions are encountered An EOF that is floating and not completing a frame An SOF that comes after another S...

Page 217: ...t Primitive Sequence In SATA for any violation of the structure of a Continued Primitive Sequence This is strictly 2 or more Primitives followed by a CONT Primitive followed by Scrambled Primitive Data or CONT Primitives For example One Primitive followed by a CONT or a missing CONT Primitive etc Multiplexing Alignment Errors MAE This counter increments when a multiplexing alignment error occurs T...

Page 218: ...rror type Table 14 PCIe Errors PCIE Errors Description Logical Idle Errors LIE At Gen3 when the Logical Idles aren t 0x00 in a Data Block with Sync Bits 10 Unknown OS Errors UOE At Gen1 2 when an Ordered Set is not one of the known Ordered Sets OS Errors OSE At Gen1 2 this indicates that this byte of an Ordered Set does not match the expected value for the current Ordered Set being decoded or is a...

Page 219: ...her than TC0 Any Set_Slot_Power_Limit Message with Traffic Class other than TC0 Any LTR Message with Traffic Class other than TC0 Any OBFF Message with Traffic Class other than TC0 Any undefined value in the Message Code Field PAD Req Violation Errors PVE At Gen1 2 when a PAD Kchar is supposed to be present but isn t Frame Length End Errors FLEE At Gen1 2 when the TLP Length field is inconsistent ...

Page 220: ...le in Meter View Metric Options The Metric Options menu is activated by selecting Metric Options from the Options menu or by right clicking on the Chart View or Meter View and selecting Metric Options The Metric Options dialog box allows you to change what is being monitored by the Chart View or Meter View for example Utilization or MBytes sec and KFrames sec Either Utilization or MBytes sec can b...

Page 221: ...gging process Logging is turned off by default You can also use the red record button in the toolbar to start and stop the logging process Figure 90 Performance Monitor Statistics Logger Base Filename and Location Data is saved as one file per port or link with the start date start time and port or link name appended to the base file name The file name format is basefilename _ day_month_year_hour ...

Page 222: ...t Excel when the csv file is imported Comma is the default choice for the delimiter which is also the default delimiter used by Microsoft Excel An example csv file for a single port is shown in Figure 91 using a comma as the delimiter Note that for display purposes not all entries are shown Figure 91 Example CSV Log File Toolbar Functions You can start pause and reset Xgig Performance Monitor from...

Page 223: ...209 PART FOUR Using Xgig TraceView ...

Page 224: ...PART FOUR Using Xgig TraceView 210 Xgig Analyzer User s Guide ...

Page 225: ...211 Chapter 11 About Xgig TraceView In this chapter Introducing Xgig TraceView ...

Page 226: ...ent Search and filter data Export and import traces or sections of traces Add move and redefine display columns Navigate and view data density through a histogram display of the data Navigate via user defined bookmarks Show embedded protocol values including errors as 10 bit values Xgig Analyzer software supports the Xgig family of test analysis devices The Xgig Xgig1000 and Xgig5000 allow you to ...

Page 227: ...213 Chapter 12 Getting Started with Xgig TraceView In this chapter Launching Xgig TraceView Working With Domains ...

Page 228: ...gin the settings of a master chassis in a Sync Group prevail for all chassis in the Sync Group If the master has authentication turned off and a slave s has authentication turned on then the Sync Group as a whole has authentication turned off The settings for the master chassis also prevail for the password the password of the master chassis will be the password of any attached slave See Xgig Blad...

Page 229: ...ppears showing the progress of opening the trace in Expert After the file has opened the Expert Chart view screen appears By switching to Report View you can view an abridged version of a report with compiled statistics taken over the entire trace To return to TraceView from the Expert View menu select Go to TraceView or click the TraceView icon on the toolbar Working With Traces Traces are files ...

Page 230: ... 1 Press the Open Last Domain button Or from the File pull down menu select Open Last Domain 2 If there is data in the analyzers for the last opened domain the TraceView decode of the information will display If there is no last domain the Select Ports Domain to Analyze dialog box appears See the steps below for selecting a new domain If no domains contain data or no domains have been established ...

Page 231: ...of Expert by selecting Options Xgig TraceView Options then choosing the Expert protocol decodes tab and turning off the Automatically launch Expert on new traces radio button in the Annotations For New Traces section Opening Files in Other Formats TraceView and Expert support a wide variety of commonly used capture or trace file formats Use the Files of type option in the Open dialog to select the...

Page 232: ...o a single file thus losing the original information about direction The converter automatically re channelizes the information so that Expert can display it correctly The converter also supports data rates and physical layers that are not handled decoded by TraceView and or Expert i e ATM SNAP Token Ring HLDC IRDA etc Conversion is possible but no useful decode information will be available Durin...

Page 233: ...omain where the ports in the domain contain no valid data the OK button is grayed out If none of the ports within the Sync Group contain valid capture data a message appears in the Port Viewing and Selection area informing you that there is no domain for TraceView to interpret for the selected Sync Group The Sync Group Domain s area shows the domain as a tree structure The Sync Group and all links...

Page 234: ...omain you have selected contains capture buffers that have been segmented choose the segment to view from the Segment s drop down box If the capture buffer is not segmented no selection is required The segment you are viewing can also be changed later from the toolbar in the TraceView decode display Port Viewing and Selection ...

Page 235: ...t contains the resources in the domain use the Password field to login Login is only required if the Sync Group is password protected The following buttons are available Blink Causes the LEDs for the selected ports to blink LEDs will blink for 40 seconds Stop Causes the LEDs to stop blinking OK Exit and use the selected chassis and ports in TraceView Cancel Close the window no domains or ports wil...

Page 236: ...e the proper license you can change the port function to be a SAS SATA Analyzer port Delay Emulator Port Indicates that the port is configured to operate as a Delay Emulator port Delay Emulator ports cannot be selected within TraceControl If you have the proper license you can change the port function to be a GE Analyzer port Unknown Port Indicates that the floating Jammer license dongle has been ...

Page 237: ...without returning to this dialog box If the domain you have selected contains capture buffers that have been segmented choose the segment to view from the Segment drop down box in the TraceView toolbar The drop down box only contains segments that contain valid capture data for viewing Each segment is completely independent when viewed in TraceView each segment has its own bookmarks and triggers N...

Page 238: ...gp for traces Select the Save button to open the Save Trace dialog box Figure 97 Save Trace Dialog Box Notice the information that has been entered in the Save to File entry shown in Figure 97 To the path that was specified in Figure 96 the file name 8G_FC has been entered as 8G_FC tgd 8G_FC tgp Note The Save as type can be also be changed to PCapNg Files pcapng or Surveyor Capture Files cap Refer...

Page 239: ...ent configuration information column displayed colors applied filters etc is saved with the new trace data file If you do not select this check box the last used configuration information is applied to the trace file when it is opened in Xgig TraceView The Time Extent selections set the limits of the trace data to save using the Start and End fields The timestamp values to use as the beginning and...

Page 240: ... for Save Gigabit Ethernet captures can be saved as Surveyor format files The Surveyor application can be used to open and view the decodes To save the trace in Surveyor format use the Save As Type box in the Save As dialog box and select Surveyor Histogram Files hst or Surveyor Capture Files cap as the file type When saving as a cap file TraceView may save the trace as multiple files More than on...

Page 241: ...227 Chapter 13 Configuring Xgig TraceView In this chapter TraceView Configuration Navigating a Trace Filter and Hide Working with Columns Detailed Find Filter Color Window ...

Page 242: ...the Viavi Xgig Analyzer TraceView Configs Default directory to load any of these configurations Configurations in this directory that begin with the prefix Default are those already available from TraceView menus Check with customer support if you need a complete description of these configurations or you would like to suggest a standard configuration that should be added to the product Saving a C...

Page 243: ...saved then a default configuration corresponding to the physical protocol is loaded If the last used configuration is for the same protocol as that of the trace being opened this configuration is used Otherwise the default configuration corresponding to the protocol of the trace is loaded Ports Side by Side Configuration TraceView can display a multiple port trace with a separate column in the dis...

Page 244: ...ugh a single physical port port 1 on blade 2 See Figure 101 for an example of Port Side By Side configuration of multiplexed ports In the example assume the multiplexed traffic is on the first and second port on the second blade The columns SAS Port 1 2 1 0 and SAS Port 1 2 2 0 show traffic for one of the logical links and SAS Port 1 2 1 1 and SAS Port 1 2 2 1 for the other logical link Use the MU...

Page 245: ...devices TraceView allows you to divide ports into Port Groups and display only the data for that group of ports Different filters and color displays can be applied to each group created for the trace The Port Group pull down on the toolbar allows you to select a Port Group for viewing within the trace or return to viewing all trace data Creating Port Groups 1 Select Define Port Groups from the Too...

Page 246: ...s dialog box Drag and drop additional ports to the group To delete a port or Port Group select it and press the Delete button For multiplexed data each link within the single physical port is selected and added separately to the port group For example SAS Port 1 2 1 0 and SAS Port 1 2 1 1 will appear as separate ports with the port group display and each can be added to the port group Selecting Po...

Page 247: ... single physical port is selected for example SAS Port 1 2 1 0 and SAS Port 1 2 1 1 you will see the trace information for one half the traffic of two different logical links Some examples of port selection for multiplexed ports are shown in Figure 105 Select All Ports Select Ports by User Defined Group Select Ports By Link SAS SATA only Select Ports By Type Select Muxed Ports in Select Single Por...

Page 248: ... for specific trace data Marked Locations You can find marked locations within a trace using bookmarks timestamps and trigger positions These marks enable you to move to locations or change the current display for a trace Histogram Controls Histograms can graphically represent an entire trace from start to end They also allow you to expand and collapse the view of the trace to look at a graphic di...

Page 249: ... s Find all Events like this pane 4 If needed drag templates to the Find tab s Except all Events like this pane 5 Continue to select drag and drop templates until you are satisfied with the conditions 6 Press OK when you are done Once the find operation is started use the Find Previous Event and Find Next Event buttons black Up and Down arrows in the toolbar to find the other events of this type A...

Page 250: ...any event in a trace is to use Quick Find Just double click any TraceView cell or any Inspector field and the Quick Find dialog will popup ready to find the currently visible field For compound columns like the Summary the Quick Find dialog comes up with the first visible field in the column if the column is left aligned or the last visible field if the column is right aligned The other visible fi...

Page 251: ... Find Quick Find Options The Quick Find dialog offers different search options when accessing a trace file versus an Xgig chassis with an older or newer AppKit software installed It also offers different options when the decode library in the CurrentProtocols pmd file has been modified by the user The Quick Find options are best when accessing a trace file They are as follows Field Decode each eve...

Page 252: ...ctory search if desired Note that Xgig chassis AppKits prior to Xgig A 5 3 do not have the ability to decode each event before searching therefore these options are not available for those AppKits The Quick Find dialog only searches for DWORD size events in the DWORD view and therefore it has a very limited set of search options in that case Field or Fixed Hex A filter or hide operation from the m...

Page 253: ...arated list range Match if the value is within the dash separated range X Y specified where X and Y are included in the comparison range Do not match if the value is within the dash separated range X Y specified The Field or Factory search option decodes and searches each event using an optimized factory compiled decode engine It is better than Simplified search option to search for deeply buried ...

Page 254: ... searching Compared to the Field or Factory search option this one does not decode every event while searching Instead it searches for the field at the same byte offset as in the current event and it searches for some additional criteria to match similar events The additional criteria are computed based on the CurrentProtocols pmd file on the client side This way this method produces accurate sear...

Page 255: ... pmd file So even if that file is customized by the user this option still produces accurate results However compared to the Field or Factory search option this search option is extremely slow and it works best on small trace files Template This option allows you to search using any template in the Viavi library as available in TraceControl or TraceView s Detailed Find dialog The second drop down ...

Page 256: ...n that case there is only one choice so you click it Finally the dialog will reverse the path from tip to root to a path from root to tip so that this template can be found again in the future and you can click it to select that choice Another way to get to the ABTS template is to start typing the path from root to tip So you can start by typing FC followed by a dot to see what comes after FC ...

Page 257: ...apter 13 Configuring Xgig TraceView Xgig Analyzer User s Guide 243 Then select FC FC FS and add another dot to see what comes after the FC FS layer Then you can click the FC FC FS ABTS 0x81 item and you are ready to search ...

Page 258: ...w the content of that template Fixed Hex This option allows searching for a specific value at a specific offset and length For example if you are searching for a frame with an undecoded raw value of 0x010203 at byte offset 36 you can use this search method as shown in the picture below If you want to search for the value 0x010203 in all frames but you don t know the offset for it which is typicall...

Page 259: ...ords by default You can choose to match the case and to match whole words Unicode String This option allows searching for a UNICODE string anywhere in the frame payload The search is non case sensitive and it matches partial words by default You can choose to match the case and to match whole words EBCDIC String This option allows searching for an EBCDIC string anywhere in the frame payload The se...

Page 260: ...value is anyone in the comma separated list in Match if the value is within the dash separated range X Y specified where X and Y are included in the comparison range and Do not match if the value is within the dash separated range X Y specified range For non numeric data only the equal to and not equal to operators are available You can also use the Or button to add an additional condition to your...

Page 261: ... for more information Search for Marked Locations Bookmarks Bookmarks are powerful tools for locating information in a trace Use them to mark event times you want to track or compare to other events or events you want to return to over and over again Bookmarking adds a tag to the event structures at that specific point in time Bookmarks are referenced in many other operations such as finds searche...

Page 262: ...m the File menu If you have deleted or added bookmarks press the Apply button to accept your changes before starting the Export operation The export import of bookmarks is designed to work for a single trace Since bookmarks are related to a specific timestamp it makes no sense to import them into a different trace You can import bookmarks and export bookmarks between a partial trace file and its o...

Page 263: ... the bookmark column with the right mouse button and select Set Bookmark The cursor displays in the Bookmark column 2 Type the name of the bookmark The bookmark is added To modify delete a bookmark 1 Right click in the Bookmark column in the bookmarked event and select Bookmark Editor from the menu 2 Retype the name of the bookmark enter a descriptive comment in the Comment field and press Change ...

Page 264: ...oolbar to limit the data to a specific protocol layer This also allows you to isolate protocol layer specific decodes If you have defined filters for the trace these filters are ANDed with the protocol layer filter If you change the port selection and the current protocol layer no longer applies it will be changed to All Protocols Based on the selected protocol layer some of the metrics in Traffic...

Page 265: ...Quick Hides are applied to the data Overlap indicates if only overlapping data is displayed The speed of the link is also displayed in the status area An example is shown below In the example the first red X indicates that no filters set up through the Filters tab are applied to the display The red X next to OS indicates that ordered sets are not displayed The green check marks indicate that the Q...

Page 266: ...d a logical operator and the value of the field in the display 4 Select the Filter radio button 5 Click the Filter button This action removes all events except those that meet the condition If you have set multiple conditions events are selected if they meet any one of the multiple conditions You can use the menus or control keys Edit Quick Find Filter Hide Ctrl F3 to bring up the dialog box Once ...

Page 267: ...Events containing either condition will be displayed Use the pull down menus to select the field and the value of the field for the second Quick Filter You can also use the Quick Filter list button to select another Quick Filter to OR conditions together Filter Source Destination Addresses When you double click in a cell under the Source or Destination column the Quick Find Filter Hide dialog come...

Page 268: ...the Quick Filter List Edit options from the Tools menu to bring up the list of Quick Filter items Or click the Quick Filter list button from the Quick Find Filter Hide dialog box when the Filter radio button is selected Figure 111 Quick Filter List Dialog Box From the list you can remove or disable any Quick Filter To disable a Quick Filter uncheck the box next to the item To remove the item from ...

Page 269: ...e of fields as you find them in the display For example hide all data from Port 3 For more complex filtering operations see the Detailed Find Filter Color window Once you have set up a Quick Hide use the ApplyQuick Hide button to enable or disable the Quick Hide condition Multiple Quick Hides can be created and Quick Hides can be completely removed rather than disabled Use the Quick Hide list butt...

Page 270: ...tring Advanced Quick Hide You can use Quick Hide to set up more elaborate filtering operations You can change the type of field the logical operator or the value of the field For columns containing numerical data the Quick Hide feature can also be used with the logical operators equal to not equal to and less than greater than Match if the value is anyone in the comma separated list in Do not matc...

Page 271: ...ll button If you set up a Quick Hide using two filtering operations each filter operation is listed separately in the Quick Hide list A Quick Hide list also exists for Dword view and Exchanges View The Quick Hide list for Dword view and Exchanges View are completely separate from the list for the main spreadsheet display Make sure you have selected the correct display main spreadsheet Dword or Exc...

Page 272: ...ld is set to 0 3 to indicate you are looking for a string that is three bits long The bits are compared with the bits indicated by the hexadecimal number specified as the value 4H The value 4H is interpreted as a bit string for the compare process so 4H becomes 0100 as a bit string The compare starts for the number of bits counting from the right of the bit string the last three bits are used for ...

Page 273: ...emplates to the Filter tab s Show all Events like this pane 5 If needed drag templates to the Filter tab s Except all Events like this pane 6 Continue to select drag and drop templates until you are satisfied with the conditions 7 Press OK to apply the filter Once the filter is applied use the Apply Filters button to toggle between applying and removing the filter The Except all events like this p...

Page 274: ... view important trace events Another feature that helps focus the display is that consecutive equal ordered sets are represented in one row with a repeat count You can refine the display to show all ordered sets show only ordered sets that are communication oriented or show only acknowledgment and error ordered sets or hide all ordered sets Select the type of ordered sets you want to view from the...

Page 275: ... PCIe traces only TLP packets Ack Nak InitFC1 2 x DLLP Packet TS1 TS2 and Any other ordered set with a physical error on it are displayed When you set the options to show ACK DLLPs and errors only the button in the toolbar will change to a traffic light with a A next to it The display hide of primitives works by toggling the button When you select the button the ACK DLLPs and error ordered sets di...

Page 276: ...lable for Fibre Channel Out of Band Data SAS SATA Only Press the Show OOB Data button to toggle between showing and hiding OOB data in the trace Hiding OOB data can decrease the amount of data in the main spreadsheet when it is not necessary to see these commands OOB commands only apply to SAS SATA For other protocols this button is disabled You can refine the display to show advanced OOB Events U...

Page 277: ...rmine whether the OOB signal detected is good or bad Figure 117 shows a diagram of OOB bursts and D C Idles between OOB bursts Based on the time lengths see Table 15 of the first through fourth D C Idle TraceView will categorize the event as good or bad This evaluation is different for each type of event COMINIT COMRESET COMSAS or COMWAKE Figure 117 OOB Event Detection Diagram OOB Event Detection ...

Page 278: ...cond or third or fourth D C idle time of a received COMINIT OOB signal is not within the range specified in Table 15 Good COMSAS This event is set when the timing of the first second third and fourth D C idle time of a received COMSAS OOB signal is within the range specified in Table 15 Bad COMSAS This event is set when the timing of the second or third or fourth D C idle time of a received COMSAS...

Page 279: ...ominal value 500 us during the RCDT phase of a SAS speed negotiation window time This event is set when the measured RCDT value lies within this range 492 5 us RCDT 507 5 us Bad RCDT detected A SAS device shall send D C Idle for 750000 OOBI nominal value 500 us during the RCDT phase of a speed negotiation window time This event is set when the measured RCDT time 492 5 us or RCDT time 507 5 us Good...

Page 280: ...he first second third and fourth D C idle time of a received COMSAS OOB signal is within the range specified in Table 15 COMSAS incorrect timing detected This event is set when the timing of the second or third or fourth D C idle time of a received COMSAS OOB signal is not within the range specified in Table 15 COMSAS Begin This event marks the beginning of the COMSAS OOB signal COMSAS End This ev...

Page 281: ...SAS link at 3 0 Gbps during SNW 2 window of the SAS speed negotiation sequence Invalid SNW 2 detected This event is set when the analyzer does not receive ALIGN 1 primitives from one or both ends of a SAS link at 3 0 Gbps during SNW 2 window of the SAS speed negotiation sequence SNW 3 Begin This event marks the beginning of the SNW 3 window of the SAS speed negotiation sequence SNW 3 End This even...

Page 282: ...window at 1 5 Gbps rate with SSC Spread Spectrum clocking enabled Train SNW 1 5 Gbps w SSC End This event marks the end of the Train SNW speed negotiation window at 1 5 Gbps rate with SSC enabled Valid Train SNW 1 5 Gbps w SSC detected This event is set if a SAS 2 phy has transmitted at least 4 TRAIN_DONE patterns and received at least 1 TRAIN_DONE primitive at 1 5 Gbps rate within MTT Maximum Tra...

Page 283: ...rate within MTT Maximum Training time 20 ms during a Train SNW speed negotiation window with SSC disabled Invalid Train SNW 3 0 Gbps w o SSC detected This event is set if a phy has not transmitted at least 4 TRAIN_DONE patterns or not received 1 TRAIN_DONE at 3 0 Gbps rate within MTT Maximum Training time 20 ms during Train SNW speed negotiation window with SSC disabled Train SNW 6 0 Gbps w SSC Be...

Page 284: ...2 us during the SNTT phase of a SAS speed negotiation window time This event is set when the measured SNTT time lies within this range 102 5 us SNTT 117 5 us SNTT Speed Negotiation Transmit time outside spec A SAS device shall send ALIGN 0 or ALIGN 1 for 163840 OOBI nominal value 109 2 us during the SNTT phase of a SAS speed negotiation window time This event is set when the measured SNTT time 102...

Page 285: ...nt is set when the analyzer receives one or more SAS 2 SNW 3 phy capabilities bits transmitted as COMWAKE OOB signals during SNW 3 window of the SAS speed negotiation sequence Invalid SNW 3 detected This event is set when the analyzer receives no SAS 2 SNW 3 phy capabilities bits during SNW 3 window of the SAS speed negotiation sequence SNW 3 phy capabilities bits Begin This event is set to indica...

Page 286: ... end of the Train SNW speed negotiation window at 3 0 Gbps rate with SSC disabled Valid Train SNW 3 0 Gbps w o SSC detected This event is set if a SAS 3 phy has transmitted at least 4 TRAIN_DONE patterns and received at least 1 TRAIN_DONE primitive at 3 0 Gbps rate within MTT Maximum Training time 20 ms during a Train SNW speed negotiation window with SSC disabled Invalid Train SNW 3 0 Gbps w o SS...

Page 287: ...gotiation window at 12 0 Gbps rate with SSC enabled Valid Train SNW 12 0 Gbps w SSC detected This event is set if a SAS 3 phy has successfully completed both transmitter and receiver training at 12 0 Gbps during a Train SNW speed negotiation window with SSC enabled Invalid Train SNW 12 0 Gbps w SSC detected This event is set if either transmitter training or receiver training fails at 12Gbps durin...

Page 288: ... speed negotiation window time This event is set when the measured SNTT time lies within this range 102 5 us SNTT 117 5 us SNTT Speed Negotiation Transmit time outside spec A SAS device shall send ALIGN 0 or ALIGN 1 for 163840 OOBI nominal value 109 2 us during the SNTT phase of a SAS speed negotiation window time This event is set when the measured SNTT time 102 5 us or SNTT time 117 5 us ATT Act...

Page 289: ...on OOB SN event or the OOB events are captured with 3G SAS SATA blades the button menu item will be grayed out Out of band data only applies to SAS SATA traces so this button menu item will also be grayed out for Fibre Channel and Gigabit Ethernet traces If the trace was not captured with Xgig Analyzer 4 0 or later a dialog will appear with following message This trace is not captured with Xgig An...

Page 290: ...splay button to complete time interval selection and view the OOB SN graphical display Figure 119 Select Time Interval for Graphical Display OOB SN Graphical Display Dialog Box The OOB SN graphical display and dialog box is shown in Figure 120 The OOB SN graphical display has two panes The lower pane is the navigation pane and the upper pane is the events pane All the events in the OOB session or ...

Page 291: ...ect events by pressing the left mouse button and dragging the mouse over the events pane before releasing the mouse button The selection is highlighted as shown in Figure 121 Duration of the current selection is displayed at the bottom of the events pane if there is a selection When the mouse is hovered on an event details of the event are displayed in a tool tip Click outside the selection to can...

Page 292: ...of the OOB SN Graphical Displays Events pane These sections are labeled in the figure below Figure 121 OOB SN Graphical Display Events Pane Navigation Pane The navigation pane displays all the events present The time period corresponding to the contents of the events pane is highlighted Drag the highlighted time window or double click the navigation pane to view different regions of the OOB sectio...

Page 293: ...ows the menus available for the OOB and Speed Negotiation Sequence Graphical Display and Figure 124 shows the toolbar See Table 22 for a description of all controls Figure 123 OOB SN Graphical Display Menus Figure 124 OOB SN Graphical Display Toolbar Port Names Contents of Events Pane Click and Drag to Move Events Pane Contents Speed Negotiation Windows Name and Duration of Window All Zoom Selecti...

Page 294: ...rmined by the data being viewed Zoom Out Click this button to show more events Zoom can be decreased until all the events are displayed in the events pane Zoom Selection Select a portion of events displayed in the event grid and click Zoom Selection to adjust the zoom so that the selection fits into the whole width of the events pane Zoom All Sets the zoom to minimum level so all events fit into t...

Page 295: ...ark End of Selection Sets the end of the selection to the current time stamp Add Bookmark Brings up a dialog to add a bookmark at the current event This menu is displayed only if the current event does not have a bookmark associated with it If already a bookmark is present the Edit Bookmark menu item is displayed Edit Bookmark Brings up a dialog to edit an existing bookmark Delete Bookmark Deletes...

Page 296: ...de 282 Xgig Analyzer User s Guide Print Preview Dialog The print preview dialog shows the contents of the events pane as it will print You can choose the printer and start the print of the events pane from this dialog Figure 126 Print Preview Dialog Box ...

Page 297: ...agement events represented by a PM in the icon column Right click a Power Management event in the main grid or DWord view and select Graphical Display of Power Management from the event grid context menu to bring up the graphical display Figure 127 Context Menu for Graphical Display of Power Management Events The buttons controls and functions in the graphical display are the same as those shown i...

Page 298: ...Chapter 13 Configuring Xgig TraceView Filter And Hide 284 Xgig Analyzer User s Guide Figure 128 Power Management Events Window ...

Page 299: ...e FC_Port State Machine dialog containing all training frames found While the file is being parsed a dialog with a progress bar appears You can choose to cancel the process by clicking the Cancel button Figure 129 Graphical Transmitter Training States Dialog The Port drop down menu contains every 16GFC port pair where at least one training frame was seen Changing the port pair in the combo box ref...

Page 300: ...a text editor Go to occurence This context menu is available on lines where a count Cnt is shown for a counter It opens a dialog where you can select a number in the range 1 Count Then the main TraceView grid highlights that occurrence of the event and you can navigate in the main grid in parallel to this dialog Description Opens a tooltip with a full description of that event When you click a hyp...

Page 301: ...e such as NVMe The information is exchanged during the boot sequence between the host and the devices It may change from one reboot to the next You can fill the device mapping in two ways First you can click the Automatically filling this dialog hyperlink at the top of the dialog When you do a popup appears instructing you how to fill the dialog automatically Second you can enter the information m...

Page 302: ...for the Source ID Destination ID fields in the Quick Find and in the Template Editor dialogs Revision ID Header Type Informational only for this release Expansion ROM Base Size and Additional BARs Used by Expert to identify the target device of a packet routed by address MSI Interrupts Addresses for each MSI interrupt sent by the device MSI X Interrupts Addresses for each MSI X interrupt sent by t...

Page 303: ...ORD contains XX XX XX XX it means that it was not accessed during that capture When you click the Save button in the Devices And Addresses dialog TraceControl prompts for re processing the trace in Expert When Expert finishes processing the trace TraceView prompts you to reload the trace with the new annotations When Expert processes a PCIe boot up sequence or an AHCI driver load it extracts the P...

Page 304: ...n one segment has a capture in it When Expert pops up the New Devices and Addresses Detected dialog click this button to carry over the boot up info and changes from one segment to the next Also when Expert does not pop up this dialog you can carry over the information to the next segment by opening the Devices and Addresses dialog and select Copy To Next Segment The Copy To All Other Segments but...

Page 305: ...her side of the link For most types of analysis this data from only one side of the link will not be very useful When the Show Overlapping Data button is selected TSV data along with grid exchange data is updated to correspond to current time extents Overlapped time is calculated per link If a partial link is available because a subset of ports are opened from chassis or a single trc file is opene...

Page 306: ...ummary fields that contain extensive decode information You can set up the columns in any way you wish including adding the exact information you want to any column TraceView includes a large library of pre defined columns that you can add to the spreadsheet display In the main spreadsheet view traffic is summed up into one row events Frames are shown in one row with a summary In SAS SATA only OOB...

Page 307: ...rt of a primitive sequence PM Indicates that the event is a power management event within the SAS protocol This icon will only display for traces created using the 12G SAS blade at 12 6 or 3 Gbps T Indicates that the event occurred after the Trigger event in the trace A red T indicates trigger events a black T indicates post trigger events It is possible for multiple ports to trigger simultaneousl...

Page 308: ... for information on the meaning of this color scheme Colors in the Dword View will be applied to the summary cell of the Dword matching the field code or event type number A numeric value in the Icon column indicates the speed of the link associated with the event For example 3 indicates 3Gbps Bm Indicates that a bookmark has been set for this event The name of the bookmark will appear in the Book...

Page 309: ... color from the standard palette or select Custom Colors to create your own colors Press Default to return the background color for this port to the default color 5 Press OK To return to the standard background color for all ports 1 Select Defaults from the Spreadsheet Options dialog box 2 Press OK To change the spreadsheet font and select a foreground color for the spreadsheet font 1 Press the Gr...

Page 310: ...eld value of 3260 Display Shorter Interpretation Same as Display Interpretation except that a shorter interpretation is displayed if one is available Among others when a field value is displayed in hexadecimal as the default format then this option strips the leading zeros for the field For example the Fibre Channel Header field S_Id is a 24 bit hexadecimal field when a hexadecimal S_Id field valu...

Page 311: ...Time Display Local Time Available for columns that contain a timestamp that shows a calendar time When selected the time is displayed in Local Time For example in Pacific Standard Time eight hours are subtracted from UTC to display Local Time Display Calendar Time Available for columns that contain a timestamp Sets the timestamp in the column as a calendar time based on the system clock at the tim...

Page 312: ...ts the timestamp in the column as a time relative to the currently selected event current event equals time zero Display Time Relative to Capture Available for columns that contain a timestamp Sets the timestamp in the column as a time relative to the start time of the capture Insert Column Brings up the Insert Column dialog box for adding a new column to the right of the current column Add To Thi...

Page 313: ... added to moved expanded or deleted just like any other column Example displays of the Summary field in the decode for various protocols are shown below Go to This Exchange in Exchanges View This context menu is enabled for SAS SATA FC PCIe and NVMe frames in the event grid that are part of an exchange When clicking this menu the corresponding exchange is selected in the Exchanges View If the capt...

Page 314: ...evice Data Other Field Group Column Displays TraceView has several other Field Groups that appear by default in the decode spreadsheet All default configurations except Default Ports Side by Side and Default iSCSI Configuration display the following Field Group columns in TraceView Side A Side B Destination Source LUN and or InitTag Tag Errors ...

Page 315: ...eam as described in the PCIe spec EI Electrical Idle as defined in the PCIe spec Loss of Sync Happens at Gen 1 2 when there are too many code violations At Gen3 it happens when there are too many consecutive 130b blocks with Sync bits 00 or 11 invalid In both cases the XGIG HW stops capturing the garbage and captures and counts the number of DWORDs during the Loss of sync until proper synchronizat...

Page 316: ...Vendor ID Device ID information provided in the Devices And Addresses dialog under the PCIe Optional node Otherwise they are displayed as the raw 16 bit hexadecimal value The Source column works in the same way as the Destination column If change the addresses displayed for the Destination column the Source column automatically syncs up and vice versa Note that the settings on which address is dis...

Page 317: ...filter on that tag to isolate all the packets of one NVMe exchange Errors Warnings Column The Errors Warnings column displays a summary of all the errors detected in the current frame or primitive The details of all the errors can be viewed in the inspector dialog TraceView detects frame embedded CRC and checksum errors The Errors Warnings column reports all the errors detected by TraceView as wel...

Page 318: ...of frame CRC for every frame However if the hardware reported a CRC Error on a frame TraceView will display the correct computed value for this frame within parenthesis for example Computed 0xD5 next to the incorrect value The following is a list of all CRC Checksums computed by TraceView Fibre Channel GigE SAS SATA or FCoE embedded frame CRC when the HW marks a CRC Error IP Checksum TCP Checksum ...

Page 319: ...ord view Similarly for the partial frames at the end of the capture those missing their CRC EOF the analyzer will not display those partial frames at the end of the capture in the main TraceView grid However if the partial frame has a physical error RD CV or CRC error then the partial frame will be shown in the main view with limited decodes Column Operations Insert New Column Inserting a new colu...

Page 320: ...nly show fields and interpretations However if you check the Show structures in suggestions instead of fields check box the dialog will show structures allowing you to choose a structure as a column Figure 136 Insert Column To insert a new column in Dword view or LaneView 1 Right click the column heading to the left of where you want to insert a column 2 Select Insert Column from the menu The Inse...

Page 321: ...tom of the dialog The drop down box has a list of all information fields in alphabetical order If you do not know the complete field name type the first few letters and use the pull down menu to select the correct field name Field names are case sensitive 4 Press the Add button The new information appears immediately in the column display for the currently selected column 5 You can repeat and add ...

Page 322: ...his feature allows you to delete an entire column on your spreadsheet To delete a column 1 Right click the column heading you wish to delete 2 Select Delete Column from the menu The column is deleted Moving a Column Moving a column is helpful for viewing types of data that you are interested in side by side with other columns of similar information To move a column 1 Select the column you want to ...

Page 323: ...conditions for your search or filter Your last ten filter find and colors will be listed in the drop down menu for the Available Templates Browser Right click a template to perform Open Cut Copy Paste Delete and Rename operations An Open operation shows the contents of the template and opens it for editing You can also double click templates already in one of the tabs or in the User Library sectio...

Page 324: ... tree you have the option of using the search field This field allows you to search the Viavi library To use the search field type the name of a template into the field with each level separated by a period for example SAS SCSI CMD ADC Inquiry 0x12 The matching templates will be displayed in a drop down window as shown in the figure below For some protocols like Fibre Channel and Ethernet the temp...

Page 325: ... MPAcmd Maps to all MPA DDP RDMA commands Figure 139 Template Search Field You can name rename open or move templates folders within the User Library section Double click a template to change its contents with the Template Editor The Available Templates Browser is context sensitive in TraceView For example if you are looking at a SAS SATA trace the browser will only show templates that apply to SA...

Page 326: ...d software errors Unframed data Data that cannot be interpreted as any of the three other types The Viavi Library section is read only You cannot move templates into this section rename templates change templates or change the structure You can copy templates to the Find Filter or Color tabs from the Viavi Library Creating a New Folder in Your User Library 1 Click one of the protocol folders insid...

Page 327: ...to values you are analyzing that are customized to your application or are different from the default settings This is accomplished by assigning names to values in the spreadsheet creating an alias for this data type Aliasing only applies to the column type you set it in It substitutes the aliased text in the display for items that perfectly match arithmetically to values you are aliasing Any valu...

Page 328: ...age Aliases Editor for the column you selected appears 2 Select the field you want to alias 3 Select the value to alias 4 In the Alias field type the name you want to add Press the Add Replace button 5 Click the Save button to save all the changes you made in the Manage Aliases Editor The Aliases Enabled check box affects all aliases in the trace just as the Enable Aliases button in the menu bar A...

Page 329: ...The Add Alias Delete Alias Delete All Aliases For This Field and Manage Alias options are also available in Template Editor by right clicking a field and selecting the Alias menu item Merging Aliases from Other Files To import aliases from another file and merge them to the current alias file select Import Aliases from the File menu in the Manage Aliases Editor If there are conflicts a dialog will...

Page 330: ...r button to change the color A dialog box will display to select the color The default color is red 7 Press OK to apply the color Once the color is applied all events that match the condition will appear in the specified color An example is shown below When the color filter is applied any CRC errors are shown in red Double click a template to modify its contents Right click a template to perform c...

Page 331: ...317 Chapter 14 Using the Secondary Panes in Xgig TraceView In this chapter Using the Exchanges View Pane Using the Details Pane Using the Traffic Summary Pane Using the LTSSM Panes for PCIe ...

Page 332: ... grid Wire events include only frames no primitives You can change which information is displayed in the hierarchy by selecting an entry from the Exchanges View drop down menu for example PDUs and Exchanges PDUs or Exchanges by making a selection from the Exchanges View drop down menu Select Exchange View from the View menu to show or hide Exchanges View You can also click the Show Hide Exchange V...

Page 333: ...n an exchange is expanded wire events and PDUs in both directions may be displayed if both ports are loaded If some of the ports are not loaded the error message No port is loaded is displayed in summary column for the wire events not loaded The direction of a wire event or PDU is indicated by an arrow next to the wire event A right arrow indicates traffic from host to drive and a left arrow indic...

Page 334: ...ened if it is available If a trc file is opened the corresponding xpt file is not automatically opened even if it is available There are no changes to the display or decodes in the other grids due to the presence or absence of Exchanges View Tx Training Summary Pane Exchanges View has a Tx Training Summary pane This pane is present only when the selected ports contain transmitter training summary ...

Page 335: ...orts multiple columns to decode and display various details for each exchange or wire event Some of the columns in Exchanges View are common with those in the event grid others are unique to Exchanges View Some of the columns provide information only for the exchange and others for both the exchange and the wire event You can add or delete columns for exchanges or wire events just as you can in th...

Page 336: ...he exchange usually a read or a write This column is shown for exchanges LBA This indicates the Target Logical Block Address for the command This column is shown for exchanges If the command is a read then the drive will start reading consecutive blocks starting at that address If it is a write then the drive will start writing consecutive blocks starting at that address Summary The summary column...

Page 337: ...of the target of the command This column is shown for exchanges Both the Actual Destination Address and Hashed Destination Address are displayed Context Menu Options All context menu options are common to Exchanges View and the event grid For an explanation of all the context menu options in Exchanges View see Context Menu Options for Columns on page 296 ...

Page 338: ...S SATA or PCIe traffic the Details Pane shows the Inspector tab only The Inspector Dword and LaneView tabs are sometimes referred to as views Inspector View The Inspector view shows you a detailed interpretation of all the raw data of an event It shows all the data interpreted in the most detail possible with Xgig TraceView You are always viewing a single event from the spreadsheet display within ...

Page 339: ...play Start of Frame Start of Frame Initiate Class 3 To disable the display of tooltips right click anywhere in the Interpretation pane and select Tooltips Disable Table 27 Hex Values for PCIe Hex Column Description AA 2 hex digits with a white background represent a regular 8B character BC K character at Gen 1 2 2D Gen3 Start of an Ordered Set Block The 2 sync bits are represented with the backgro...

Page 340: ...re Channel or 4 2500 Gbps FC scrambling On during capture the scrambled data is generated and the scrambled form will display in the 10 Bit tab 66 Bit Tab The Inspector 10 Bit tab has been replaced by a 66 Bit tab for all 16G FC traces for all 10GigE traces captured using Xgig1000 10G ports and for all 10GigE 40G traces captured using the Xgig1000 40G ports The 66 Bit tab displays 66B transmission...

Page 341: ...ple 32 bit words 66B events map to two 32 bit words Inspector view displays the full 66B event on the line of the first corresponding 32 bit and a text message on the next line telling the user to look at the previous line for the full 66B event So for a BB_SCr Idle 66B transmission word TraceView displays the full 66B transmission word in the Inspector window 66B tab for the BB_SCr line Then for ...

Page 342: ...data will highlight as well The Tree Tab is composed of two areas which can be resized as needed The left portion shows the tree view of decoded protocols for the current event The right portion shows the hex values for the event and their ASCII or EBCDIC representation The hexadecimal area can be resized for a display of anywhere between 4 and 32 bytes of data per line Move the slider in the midd...

Page 343: ...on in the General and Tree tabs of the Inspector pane right click a field and select Field Information from the context menu Quick Find Filter Hide in Events View You can access the Quick Find Filter Hide dialog and search for data in the events grid based on fields in Inspector View Creating a Template For a Field You can create a template based on a field in the Interpretation column of the Gene...

Page 344: ...og For more information on the Decode Switches menu in this editor see Decode Switches Menu on page 331 Once you have finished editing the template click Copy then paste the template into the desired product s template User Library tree by selecting Paste from the context menu Editing a Frame You can edit the contents of a frame The Edit Frame option is available for the General and Tree tabs This...

Page 345: ...y the correct recalculation of the CRC and checksum click the Recalculate CRC s Checksum s button at the bottom of the window Decode Switches Menu Some templates allow you to specify decode switches If the template you are creating has this option the Decode Switches menu appears in the upper left corner of the window The decode switches provide detailed contextual options for decode for example f...

Page 346: ...grids and having the grids scroll independently Several options are available for the display of a data column in Dword view Right click a data column header and select the type of display Data can be displayed in 10 Bit Data KChar Scrambled Data Hex or ASCII format You can insert a column if you need to display the data in two or more formats within the grid See Insert New Column on page 305 for ...

Page 347: ...re information on using Quick Find Filter Hide Activating the Quick Find Filter Hide dialog for Dword view is the same as main event view Double click a row in the Dword view and the Quick Find Filter Hide dialog will appear with contents matching the row A filter or hide operation from the main spreadsheet does not affect the Dword display All Dwords within the trace remain in the display when a ...

Page 348: ... in LaneView Right click a data column header and select the type of display Data can be displayed in 10 Bit Data KChar Scrambled Data Hex or ASCII format You can insert a column if you need to display the data in two or more formats within the grid See Insert New Column on page 305 for information on inserting a new column in LaneView You can enlarge or reduce the size of the font in the LaneView...

Page 349: ... Field or Fixed hex options are available in LaneView See Quick Find on page 236 for more information on using Quick Find Filter Hide Activating the Quick Find Filter Hide dialog for LaneView is the same as main event view Double click a row in the LaneView and the Quick Find Filter Hide dialog will appear with contents matching the row A filter or hide operation from the main spreadsheet does not...

Page 350: ...Fibre Channel will contain the Traffic Summary data If the trace does not have Traffic Summary data the Traffic Summary pane will not display and the Traffic Summary option in the View menu will be grayed out Traffic Summary data capture is supported for 6G and 12G SAS SATA traffic and for Fibre Channel traffic captured on an 8G Xgig blade a 16G Xgig5000 blade or 16G ports on Xgig1000 systems You ...

Page 351: ...Using the Traffic Summary Pane Chapter 14 Using the Secondary Panes in Xgig TraceView Xgig Analyzer User s Guide 337 Figure 152 Traffic Summary Example for SAS SATA ...

Page 352: ...View Using the Traffic Summary Pane 338 Xgig Analyzer User s Guide Figure 153 Traffic Summary Example for Fibre Channel Traffic Summary Toolbar Buttons and Menus Figure 154 shows the toolbar and Figure 155 shows the menu items available when you select ...

Page 353: ... the report to review metrics that are either up or down within the metric hierarchy Show columns by ports Controls the columns displayed for all metrics Show columns by ports will show the counts by port only For example Link 1 SAS Port 1 1 1 and Link 1 SAS Port 1 1 2 Show columns by links Controls the columns displayed for all metrics Show columns by links will show the counts by link only For e...

Page 354: ...in the tree for the currently selected metric or the branches are already displayed the button is grayed out Hide all the sub categories of metrics that are displayed for this type of metric If there are no branches in the tree for the currently selected metric or the branches are not displayed the button is grayed out Hide zero entries Show hide all metrics that have a value of zero Go to previou...

Page 355: ...ge 11 30 the next 30 times range 31 60 and the last 40 times range 61 100 The Event Number box will display 1 when you initially select the counter and the sequence of numbers as you navigate down are 1 11 31 and 61 When you navigate using next occurrence the Event Number box will show 11 and the current location is the start of the next occurrence of the primitive with a repeat count Navigating a...

Page 356: ...s Primitives This category includes metrics for all primitives within SMP SSP or STP connections as well as all SAS SATA primitives that are not connection oriented Connections This category includes connection counts Counts are categorized based on the open protocol as SSP STP or SMP connections The counts are further categorized as accepted or rejected connections and rejected connections are ca...

Page 357: ...hardware CRC Error Counts all CRC errors Framing Error Counts all occurrences where a frame is abnormally terminated or an EOF is found outside of a frame Loss of Sync Counts all occurrences where there is a Loss of Sync or Loss of Signal Primitive Error Counts all occurrences where a Dword is detected that has a K character but is not a standard primitive Primitive Sequence Error Counts all occur...

Page 358: ...idle time of a received COMSAS OOB signal is within the range 700 to 1525 ns COMWAKE This counter increments when the timing of the first second third and fourth D C idle time of a received COMWAKE OOB signal is within the range 70 to 160 ns SATA Port Selection OOB This counter increments when a SATA Port Selection OOB signal is detected Invalid COM Events COMINIT COMRESET incorrect timing This co...

Page 359: ...nt is set when the analyzer receives ALIGN 1 primitives from both ends of a SAS link at 3 0 Gbps rate during Final SNW window of the SAS speed negotiation sequence Valid Train SNW This counter increments when any Valid Train SNW event is detected regardless of the speed or parameters set for the speed negotiation ATT Actual Training time within spec This counter increments when an ATT within spec ...

Page 360: ...in SNW This counter increments when any Invalid Train SNW event is detected regardless of the speed or parameters set for the speed negotiation ATT Actual Training time outside spec This counter increments when an ATT outside spec event is detected The event is set when the measured value of ATT is not within TLT Training Lock Time which is defined to be 28497920 OOBI or 18 998613 ms RCDT Rate Cha...

Page 361: ...to the specific primitives are listed under the primitive type In SAS SATA traces if the analyzer does not capture the beginning of a Primitive Sequence then that sequence will not be included in the Traffic Summary Counters If you are not sure if a sequence is being counted look for a beginning of a sequence icon in the DWord View If none are marked as such then the sequence will not be included ...

Page 362: ...re counted by each type of request or response SATA Frames Counters include all types of SATA frames Counters are included for all types of SATA errors as indicated by the SATA error bits Note that frames be counted more than once within the FIS error counters if they have more than one error bit set Unknown Counters for SAS SATA Frames Where appropriate there are counters for unknown frames types...

Page 363: ...ds are counted in the added dynamic counter s in a sub level of the Traffic Summary hierarchy The primary counter is always the total of all dynamic counters that are within its branch in the hierarchy Dynamic counters are added for two types of frame counters the SSP counter SSP Command Frames and the SATA counter Reg Host Dev Command FIS See Figure 156 for an example of dynamic command frame cou...

Page 364: ... but the sub level counters of specific addresses only appear if an open frame with a specific address or address pair is encountered in the decode This provides a count of open frames by each address or address pair The primary counter is always the total of all dynamic counters that are within its branch in the hierarchy The figure below shows an example of the open frame address counters displa...

Page 365: ...rotocol STP Open Frames Counts Open Address SOAF frames for the STP protocol Open Frames by Src Dest Counts all Open Address SOAF frames that have a source and destination address Expand the tree under this counter for counts by specific source destination address pairs Open Frames by Src Address Counts all Open Address SOAF frames that have a source address Expand the tree under this counter for ...

Page 366: ...web site http www t10 org drafts htm for up to date SSP specifications Refer to the CurrentProtocolVersions txt document in the installation directory for information on the SAS SATA specification ATAPI Transaction Request Sizes AT Attachment with Packet Interface ATAPI is the older standard interface used to connect storage devices such as hard disks solid state drives and CD ROM drives inside pe...

Page 367: ...rent Transfer Length were found so therefore only one dynamic counter 0x0001 is added in the sub level for that counter The first event of this type is currently selected and highlighted in the decode For the counter Read FPDMA Queued Request Sizes two dynamic counters were added 0x0001 and 0x0008 This is because requests of this type were encountered with two different transfer lengths Note that ...

Page 368: ...gig Analyzer User s Guide Figure 158 Transaction Request Size Dynamic Counters Transfer Length Sector Size Dynamic Counters Primary Counters The event highlighted in the Summary Pane is the first of four events in the decode that are SSP Read 10 Request Sizes with a Transfer Length of 0x0001 ...

Page 369: ...and unknown Ordered Sets Fibre Channel Frames This category includes metrics for all Fibre Channel frames This includes Basic Link Services Link Control Frames Extended Link Services Fibre Channel FC Switch SCSI over Fibre Channel and Frames by source destination type class of service and sequence type Frame Delimiters This category includes metrics for start of frame SOF and end of frame EOF orde...

Page 370: ...hen there are multiple primitives of the same type for example ARB there is a metric in the hierarchy that counts all primitives of that type In this case they are ARB FF ARB x y ARB AL_PA Counters that break out the metric into the specific primitives are listed under the primitive type Traffic Summary FC Frame Counters TraceView counts various Fibre Channel frames The frame counter metrics are d...

Page 371: ...d reject reason FC Switch Fabric Services one counter per request accept and reject reason SCSI over Fibre Channel SCSI Commands one counter per 8 bit SCSI opcode SCSI Task Management one counter per SCSI Task Management IU SCSI Responses SCSI Status one counter per SCSI status SCSI Response Codes one counter per FCP response code FCP_CONF Frames FCP_CONF frames Frames by Source Destination up to ...

Page 372: ...imary counter is always the total of all dynamic counters that are within its branch in the hierarchy Dynamic counters are added for the SCSI over Fibre Channel counter SCSI Commands Dynamic Counters for Source and Destination Addresses Counters for source destination addresses are dynamic meaning counters are added for each source address destination address or source destination address pair enc...

Page 373: ...nt view and the Lane View page 334 to display the handshake between the host and the target Figure 160 LTSSM Views The port link names are shown in the view headings When you edit the port link name aliases LTSSM reflects the new names for the column headings Caution LTSSM debugging gets the best results when all of the data is captured and data is not filtered before it is processed To capture th...

Page 374: ... times Click the Start button to start generating the LTSSM data Figure 161 Generate LTSSM Data Dialog Box When you click the Start button filter settings used for the capture are validated If the settings are not correct an error dialog is displayed describing which filter setting to use in TraceControl to recapture the trace The LTSSM generation will not be allowed to proceed until the recapture...

Page 375: ...lowchart view will also be highlighted The first event corresponding to the beginning of the state will be highlighted in event grid and lane view grid If a state s transition to the next state is invalid according to protocol specification a red border will be displayed around the state You can mouse over the states that have a red border to display a tooltip describing its invalid transition Als...

Page 376: ... view You can use previous next buttons to navigate or input a number in the Event Number box to navigate to a specific instance The selection box at the top of the Metrics View is called the Event Number box The Event Number box allows you to select the number of the occurrence for the currently selected metric and syncs the main grid and Lane view grid to that location in the trace The total num...

Page 377: ...ubble corresponding to the selected event in the Flowchart view and state box in Box Car view are highlighted Invalid states are displayed with a red border Counts are shown for each state or transition that is not grayed out There are three different views for the Flowchart view One is Overall view In this view all the main states are shown When the selection in Box Car view is a main state or th...

Page 378: ...364 Xgig Analyzer User s Guide Figure 166 Flowchart View with Sub States Configuration Recovery You can zoom in or out on the Flowchart using the zoom tool at the bottom of the Flowchart view This tool allows you use the slider or step through the sizes using Zoom In or Zoom Out buttons ...

Page 379: ...365 Chapter 15 Xgig TraceView Histograms In this chapter Histogram Overview Histogram Controls ...

Page 380: ...ting of events You can also navigate to an area of the trace by double clicking on the location in time you want to display Using the Entire Trace Histogram lower histogram The gray box on the lower histogram can be resized to zoom into a smaller area in the trace This is reflected in the upper histogram The yellow extent marks can be moved to narrow the view of the trace Click and drag with the m...

Page 381: ...play in the upper histogram Left Arrow Mouse Icon When you pass the mouse over the left edge of the gray area the left arrow mouse appears Click and drag to change the left extent of the detail area Right Arrow Mouse Icon When you pass the mouse over the right edge of the gray area the right arrow mouse appears Click and drag to change the right extent of the detail area Right Click Either Histogr...

Page 382: ...Chapter 15 Xgig TraceView Histograms Histogram Controls 368 Xgig Analyzer User s Guide ...

Page 383: ...369 Chapter 16 Xgig TraceView Template Editor In this chapter Using Template Editor ...

Page 384: ...editor uses the template you have selected as the starting point for creating a new template After you have made all your selections to create the new template press OK Give the template a unique name to avoid confusion You can store your new template in any location in the User Library An example of the Template Editor dialog box is shown in Figure 168 The area on the left shows specific byte val...

Page 385: ...ontents of the template select the desired field strings on the right or enter hex and Xs on the left You can either replace the existing values with those you have selected or you can insert the new values in the location selected thereby shifting the original value to the next field Replace is the default function for editing frame byte contents Pressing the Insert key on your keyboard before yo...

Page 386: ...tion rather than translated to hexadecimal for direct entry in the byte pattern Figure 169 shows in place editing for an IP address For the context menu available from each tree node the menu contains some or all of the following options depending on the current item selected Edit This menu item is only available on editable fields Select Edit to directly edit the field value in Tree View the area...

Page 387: ...ng Tab The Template Editor dialog box appears when you double click any editable template Some templates have a Containing tab The Containing tab allows you to specify a byte pattern to match anywhere in a frame s payload or header The Containing tab is only available for frames An example of the Template Editor with the Containing tab visible is shown in Figure 170 ...

Page 388: ... 6 Make sure you rename the new template Qualifiers Tab The Template Editor dialog box appears when you double click any editable template Some templates have a Qualifiers tab The Qualifiers tab allows you to further refine your find or filter for frame ordered set or unframed data Qualifiers are elements that can be useful for find or filter operations but are not a simple pattern match of the da...

Page 389: ...Click the Qualifiers tab 4 Change the qualifier options See below for the available options 5 When you have completed specifying qualifiers click OK 6 Make sure you rename the new template Qualifier Options Qualifier options are Port Selection Check All Ports if you want to filter or find within all ports Click next to the port number s if you want to filter or find data for a specific port s Erro...

Page 390: ...r Fibre Channel templates iSCSI options do not display The Decode Switches menu within the Template Editor is used to help you create a user defined template Any Decode Switches used within the Template Editor only apply to the single template you are creating they do not affect global settings for Decode Switches When editing a User Library template Decode Switches are stored inside the template ...

Page 391: ...terpretation Shows up on SCSI Data frames for SAS SATA and Fibre Channel It contains a list of all possible FC AE FCLP Data frames When appropriate some of the global Decode Switches described in the section Decode Switches on page 385 are also visible in the Template Editor Proper Use of Template Editor Decode Switches Be aware that the Decode Switches are a tool to help you create templates but ...

Page 392: ... determine which type of frame to compare to The Decodes Switches in the Template Editor can be a critical tool for selecting the proper bit pattern however do not mistake this for an absolute method of selecting only those frames that have a particular decode switch value There are numerous ways to narrow your search filter further using templates and other capabilities of Xgig Analyzer software ...

Page 393: ...n can be set to the corresponding data frame It is often easy to create a template for the command frame that will give you 100 accuracy after the arm condition is met you will receive the corresponding data frame shortly after By using the Arm Trigger technique you greatly improve the chances of hitting the right frame ...

Page 394: ...Chapter 16 Xgig TraceView Template Editor Using Template Editor 380 Xgig Analyzer User s Guide ...

Page 395: ...381 Chapter 17 Annotated Traces Expert Traces and Decode Switches In this chapter Working with Traces Annotated by Expert Working with Expert Traces Decode Switches ...

Page 396: ...mand information for every SAS SATA NVMe PCIe AHCI iSCSI and Fibre Channel frame The additional information provides significant advantages for search filter hide by address command information These Expert Annotations are visible in the Side A Side B Summary Tag InitTag and LUN columns of the default configurations as well as in the Inspector Window They can also be added as separate columns with...

Page 397: ...aceView Expert continues running in the background until it has finished You may load partial annotations during the process if need be Looking at the bottom of Figure 174 Partial Annotations in TraceView note that there are two colored lines a magenta colored line and a teal colored line in the histogram area The magenta colored line shows the portion of the trace that has already been processed ...

Page 398: ...ions from the Select Ports pull down menu You can select a view of just the original trace just the new events added by Expert or both If you choose to view just the original trace you will still see the Expert Annotations added by Expert to existing events Below are examples of the Select Ports pull down when viewing an Expert Trace Important An Expert Trace is different from an Expert Annotation...

Page 399: ...tations depending on the type of devices sending and receiving data Set decode switches so your trace is interpreted correctly by the TraceView decodes Each decode switch affects the interpretation of a specific protocol To set a decode switch select Decode Switches from the View menu and navigate to the proper area to set the switch The decode switches set from the View Decode Switches menu affec...

Page 400: ...rimitives select Decode Switches C Encodings There are two decode choices available By default TraceView assumes that the C primitive contains the 16 bit Config_Reg data which corresponds to the Config_Reg base page encoding switch However when the Next Page bit of the Config_Reg is set to 1 then the next C primitive should be interpreted using the Next page encoding switch until the Next Page bit...

Page 401: ...can disable it using the switch Disable FC AE FCLP SCSI DATA Integrity Field T10 DIF The SCSI Block Device protocol specification SBC 3 defines a protection information model to protect the data from malicious and unintentional corruption Under that model the SCSI data frames contain some Data Integrity fields DIF at a fixed interval within the data The interval is typically either 512 bytes or 40...

Page 402: ...tional 16 bit millisecond resolution timestamp is added after the 32 bit timestamp This timestamp is also added by command line argument Load Tester Signature at beginning of payload This option enables the decoding of 24 byte Load Tester records at the beginning of the Fibre Channel payload for every FCoE frame Load Tester Signature at end of payload This option enables the decoding of 24 byte Lo...

Page 403: ...R SRP Protocol is assumed IP TOS Interpretation Sets the interpretation for the Layer 3 Type of Service field Set the interpretation to TOS or Differentiated If IP TOS Interpretation is not used or not relevant to your trace analysis leave all options unchecked Reserved Obsolete Values Sets the interpretation for bits that are reserved vendor specific retired not applicable or obsolete These bits ...

Page 404: ...Chapter 17 Annotated Traces Expert Traces and Decode Switches Decode Switches 390 Xgig Analyzer User s Guide Figure 176 Hide Reserve Bits left Show Reserve Bits right ...

Page 405: ...Traces Expert Traces and Decode Switches Xgig Analyzer User s Guide 391 Figure 177 Report Invalid Reserve Bits as Errors You can use Quick Find Filter Hide and the Errors Warnings column to Find Filter Hide frames with Invalid Reserve Bits ...

Page 406: ... the vendor names This is the default value Display OUIs in Hexadecimal This option disables the display of the vendor names The 24 bit hexadecimal value is displayed instead Brocade VE Port Frame Decoding This switch is necessary to decode the frames on Brocades s VE Ports which otherwise look like random data Disable VE Port Frame Decoding This is the default behavior where we decode the standar...

Page 407: ...393 Chapter 18 Converting Files from Other Platforms In this chapter Converting Bus Doctor Files Converting I Tech Files ...

Page 408: ...ed files are displayed in the TraceView spreadsheet view using the protocol color coding familiar to Bus Doctor users See Protocol Display Color Coding on page 437 for information on colors used for this display Display colors can be changed as described in Spreadsheet Options on page 294 Supported Bus Doctor trace file formats Xgig Expert and Xgig TraceView support the following saved capture typ...

Page 409: ...aracters are converted with the exception of errors To greatly speed up conversion and analysis time by Expert the converter by default does not convert SATA_HOLD SATA_HOLDA SATA_R_IP SATA_CONT or SATA_SYNC primitives These primitives are not typically utilized by Expert other than for a couple of very subtle performance metrics and the trade off is MUCH faster trace conversion and processing time...

Page 410: ...lt in both Xgig Expert and Xgig TraceView Converting I Tech Files Xgig Expert and Xgig TraceView support SAS v1 1 Serial Attached SCSI and SATA Serial ATA captures taken from I Tech analyzer platforms Xgig Expert provides full SAS Link Layer SL Serial ATA Tunneled Protocol STP and Serial SCSI Protocol SSP experts and metrics for both single transmit receive links as well as wide links of up to 4 l...

Page 411: ... convert 5 If the trace has been previously converted you will be prompted to overwrite the trace or abort the conversion 6 The trace will then be converted to Xgig trace format A screen displays showing the progress of the conversion Once conversion is complete the trace automatically opens in the Xgig application Opening traces Once the trace file has been converted the files can be reopened by ...

Page 412: ... ViaviViavi Xgig Analyzer For detailed information on the IOConverter run IOConverter exe h from the command line I Tech specific notes The I Tech analyzer provides a mechanism for truncating frames in the capture to a user specified number of bytes Use of this option causes primitives within frames to be discarded automatically thus risking the potential of missing critical primitives such as R_R...

Page 413: ... Fibre Channel trace and GBE for Gigabit Ethernet traces Additionally each of the filenames locations are placed into a TGP file Trace Group File which is the file type that is opened by default in both Xgig Expert and Xgig TraceView Table 36 I Tech to Xgig Port Name Conversion I Tech Name Xgig Port Name Port Name Meaning Channel 1A SAS_Port 0 Initiator transmit port for Link 1 Channel 1B SAS_Port...

Page 414: ...Chapter 18 Converting Files from Other Platforms Converting I Tech Files 400 Xgig Analyzer User s Guide ...

Page 415: ...Information on Decodes Delta Calculator Copy Event Data Filter on Data Events Export to Text File Print the Selected View Show Capture Configuration Get Trace Information Timestamp Options TraceView Options TCP UDP Port Mappings WWN and MAC Address Decoding ...

Page 416: ... Click the Delta Calculator button in the toolbar or double click the timestamp The Delta Calculator dialog box appears 2 Select the pull down tab under Delta Start Time and select a bookmark 3 Select the pull down tab under Delta Stop Time and select a bookmark The delta time displays in the Delta Calculator dialog box To use the Delta Calculator with timestamps from the spreadsheet 1 Click the D...

Page 417: ...pecifically Copy Event Data could be used for creating filters or finds based on event data within the trace Once event data has been copied it can be used as a template in either TraceView or TraceControl In TraceView the template allows you to quickly search for complex events In TraceControl the template allows you to create trigger conditions for events discovered in TraceView The copied event...

Page 418: ...rst 32 bytes of the data are exported The exported file contains the data interpretation as displayed in the Summary column For example if Display Short Interpretation is selected short summary information is exported to the file If Display Raw Data is selected raw data is exported If the Summary column is not included in the column display payload frame data from the Summary field is not included...

Page 419: ...ew you have currently selected the main spreadsheet or Dword view All columns for the events that appear in the display will print If you want to print a display with many columns set the printer to print in landscape mode Show Capture Configuration Select Show Capture Configuration for the File menu to open a dialog that shows a read only version of the capture configuration defined in TraceContr...

Page 420: ...roseconds nanoseconds An option is also available to convert UTC time values to local time if the trace is from the Xgig chassis The default option in the Timestamp Format window is mm dd hh mm ss ms_us_ns There are also three different ways to reference timestamps in the display Set this option be right clicking on a timestamp column or field Display Calendar Time Sets the timestamp to display as...

Page 421: ...e microsecond format and you change from relative to calendar the timestamp format will change to the mm dd hh mm ss ms_us_ns format When TraceView is set to show calendar time and the timestamp is changed to show any timestamp format without mm dd the timestamp changes to Time Relative to Capture Xgig hardware supports the conversion between UTC and LOCAL time UTC time conversion is not available...

Page 422: ...t before clearing the Quick Filter Quick Hide lists If enabled TraceView presents a confirmation message when you press the Clear button in the Quick Filter List or Quick Hide List dialog box Prompt when duplicate Bookmarks are created If enabled TraceView presents a confirmation message when you attempt to create a bookmark for an event that has already been bookmarked Prompt when CurrentProtocol...

Page 423: ...between the OOB Sequence and Speed Negotiation Sequence at a high level Inside of an OOB sequence the markers show the begin and end limits of different OOB signals Inside of a Speed Negotiation sequence the markers show the begin and end limits of different speed negotiation windows Navigate to a particular OOB signal or speed negotiation window by syncing to these markers This is especially usef...

Page 424: ... not automatically be run for new traces nor will you be prompted if you want to run Expert The following options are available for incompatible annotations Prompt to launch Expert on incompatible annotations and re assembled events This is the default setting Selecting this option will bring up a pop up dialog asking if you would like to launch Expert or not Then you have the choice to run Expert...

Page 425: ...lay each frame header as a separate row within the spreadsheet for Port Side By Side view Frame summaries are also displayed as a separate row Display 1 word per line like in the inspector Select this option to display each Dword as a separate row within the spreadsheet for Port Side By Side view Partial information for each Dword may be displayed Use the check boxes under this option to set the o...

Page 426: ...this option Quick Find will automatically perform a simplified search when the Field search is selected when possible and appropriate Otherwise it will perform a compiled decode search Force decoding of every frame while searching When you select this option the Field search option is replaced by Factory search and Simplified search and Factory search is selected by default Force using simplified ...

Page 427: ...thod for creating entries is to copy lines from TCPUDPServices txt paste them in UserTCPUDPServices txt remove the beginning and then modify them TraceView and Expert loads both files every time they are launched For example assume you want to display port 3260 as HTTP rather than as iSCSI The default TCPUDPServices txt file defines the TCP port 3260 as iSCSI 3260 tcp iSCSI iSCSI Copy the line int...

Page 428: ...tion file is available in the installation folder of the Xgig Analyzer 24 bit numbers found in the decode are mapped to the corresponding vendor name by the Xgig applications You can change the default OUI number mappings by editing the OUI txt The content of the file is read at the Xgig applications startup Open the file in a text editor for more information It is also possible to disable the OUI...

Page 429: ...415 Chapter 20 Xgig Trace View Hints and Tips In this chapter Trace View Hints and Tips Toolbar Keyboard Shortcuts ...

Page 430: ... the Dword tab in the Details Pane to see SAS SATA traces Dword by Dword To return to the last viewed trace in the same domain open TraceView and press the Open Last Domain button The TraceView application automatically saves the current configuration upon exiting and uses it next time Hide the Histogram and Inspector panes to increase the number of events being viewed Navigate Search Drag and dro...

Page 431: ... in the list You can add information to a column by selecting Add to this Column so it contains exactly the information you want TraceView s list of pre defined columns includes special composite columns called field groups Field groups are columns full of useful decode information Select the Ports Side by Side configuration from the File Load Configuration Default Ports Side by Side menu to see a...

Page 432: ...of trace data is saved to a file Export Trace to File Button This button exports the contents of the trace to a text file Show Details Pane Button Press this button to toggle between show and hide of the Details Pane The Details Pane displays at the bottom of the screen and shows you a detailed interpretation of allthe raw data of an event Open Trace Button This button opens a trace file trc or a ...

Page 433: ...y created port groups select a link or select all ports Trace Information Button Brings up a message box with information about the current trace Xgig Expert Button This button launches or jumps to the Xgig Expertprogram XgigExpertdisplaysyour trace in a chart form and a report form using an array of metrics To return to Xgig TraceView click the Xgig TraceView icon on the Xgig Expert toolbar Segme...

Page 434: ...plying and removing the filter Filters are set up through the Filter tab of the Detailed Find Filter Color dialog Quick Filter Button Use this button to enable or disable QuickFilterconditions Select Quick Filter List fromtheToolsmenuto see the current list of Quick Filters Show Hide OOB Button Use this button to show hide Out of Band data for SAS SATA Use the pull down menu to set options Quick H...

Page 435: ...vents This display is available for 6G SAS SATA blade only Go To Trigger Button The trigger button jumps to the trigger position in the trace All the events after the trigger in the trace are displayed withTs inthe Icon column Layered Protocol Button This drop down menu allows you to view events by protocol layer Enable Aliases Button This button toggles aliases off and on Graphical Transmitter Tr...

Page 436: ...ious occurrence F11 In Traffic Summary Go to next occurrence Keyboard Shortcuts When Selecting Column Data Ctrl Q Quick Find Filter Hide Ctrl R Set Alias Ctrl C Copy Event Data Keyboard Shortcuts from Bookmark Column Only Ctrl R Bookmark Ctrl 1 Set Global Cursor 1 Ctrl 2 Set Global Cursor 2 Keyboard Shortcuts From the Available Template Browser Enter Open Ctrl C Copy Ctrl X Cut Ctrl V Paste Del De...

Page 437: ...423 PART FIVE Using Xgig Expert ...

Page 438: ...PART FIVE Using Xgig Expert 424 Xgig Analyzer User s Guide ...

Page 439: ...425 Chapter 21 Xgig Expert In this chapter Key Features of Xgig Expert Opening a Trace Switching to TraceView ...

Page 440: ...t program Also refer to the Xgig Expert Analysis Tool for Fibre Channel Networks A Case Study and User s Guide for an extended example of using Xgig Expert software Some key features of Xgig Expert are listed below The Graph View button allows you see key metrics over time as line graphs Data rate is given in megabytes per second as well as I O per second The queue depth is plotted for all initiat...

Page 441: ...eView or click the Xgig TraceView icon on the toolbar TraceView automatically jumps to the timestamp nearest to the currently selected item in Expert You can also right click a timestamp in the Timestamp window of Xgig Expert and select Copy Switch to Xgig TraceView paste the timestamp into the Timestamp box of TraceView and press Enter Figure 193 Xgig Expert Main View ...

Page 442: ...Chapter 21 Xgig Expert 428 Xgig Analyzer User s Guide Figure 194 Xgig Expert Graph View ...

Page 443: ...429 PART SIX Appendices ...

Page 444: ...PART SIX Appendices 430 Xgig Analyzer User s Guide ...

Page 445: ...ll the data collected by a single Gigabit Ethernet analyzer hardware port alias extension Aliases file for a trace An alias file is a file containing all of the aliases for a trace file It has the same name as the trace file tgp extension Trace Group Files Trace group files tgp are a collection of trace files bus trc or gbe for the Xgig Analyzer The trace group file only contains a list of trc or ...

Page 446: ...ls all configuration for capturing traces This includes the information you can specify from the Xgig TraceControl Configuration screen such as link speed setting signal regeneration setting trace size options capture options and trigger options ffg extension Filter Group Configuration files The Filter Group configuration file ffg saves all configuration information applied to the Find Filter and ...

Page 447: ...ere are many other possibilities After reading this section if you need help with a special configuration contact Customer Support Make sure that you connect the blade ports to the correct media type Fibre Channel ports to Fibre Channel links GigE ports to GigE links or SAS SATA ports to SAS SATA links Warning Do not look directly into the end of a fiber or the connector Exposure to laser radiatio...

Page 448: ...d port 2 or port 3 and port 4 on the same blade In the example below each link is connected to port 1 and to port 2 on an Xgig Multi Function Blade Figure 195 Xgig Direct Connection Some examples of unusable connections follow You cannot connect one side of the link to blade 1 port 1 and connect the other side of the link to blade 2 port 1 You cannot connect one side of the link to blade 1 port 2 ...

Page 449: ...ssis Use the Receive side right side of the ports ONLY when passively monitoring a link with the Xgig Multi Function blades To correctly monitor both directions of a Fibre Channel link through a tap each side of the link must be connected to the receiving ports of the same port pair Domain creation is performed using the TraceControl program By attaching both tap ports to the ports of an Xgig Mult...

Page 450: ...O O O O O O O O O O O O O O O O O O O O O O O O O O O O O O O O O O O O O O O O O O O O O O O gig Cascade In Out Management Ultra2 SCSI Trigger In Out Power 1 2 3 4 Xgig Chassis Fiber Tap OUT IN OUT IN OUT A OUT B PORT A PORT B ANALYZER Fiberoptic Switch Disk in SAN Network Fiber Tap OUT IN OUT IN OUT A OUT B PORT A PORT B ANALYZER OUT IN OUT IN OUT A OUT B PORT A PORT B ANALYZER Fiber Tap Disk in...

Page 451: ...mn For SATA color is applied on the count OS IU Type FIS column For FC color is applied on the count OS Rctl column For Dword view and in port side by side view the port column is colored Primitives including SOF and EOF not shown as separate events in the spreadsheet display do not have an assigned color However since these primitive events show on separate lines in Dword view they will have an a...

Page 452: ...BHSopT SCSI Resp 0 128 0 255 255 255 BHSopI Login Cmd 153 35 66 255 255 255 BHSopT Login Resp 0 128 128 255 255 255 Everything else 255 255 255 0 0 0 Table 39 Fibre Channel Color Coding Item Background Color RGB Components Foreground Color RGB Components Any Error 255 255 255 255 0 0 Ordered Sets 255 255 255 128 128 0 FCP_CMND RCtl 06 FCP_RSP RCtl 07 0 128 0 255 255 255 Loop Init Sequence 255 102 ...

Page 453: ...5 SATA_FIS46 0 128 0 255 255 255 SATA_FIS58 0 128 128 255 255 255 SATA_FIS5F 51 204 204 0 0 0 SATA_FISA1 224 224 224 0 0 0 SSP_IU01 0 128 0 255 255 255 SSP_IU05 0 128 0 255 255 255 SSP_IU06 0 128 0 255 255 255 SSP_IU07 0 128 0 255 255 255 SSP_IU16 0 128 0 255 255 255 SSP_IU40 0 0 128 255 255 255 SSP_IU41 0 0 128 255 255 255 AF0 153 35 66 255 255 255 AF1 153 35 66 255 255 255 Vendor Specific UIF0 F...

Page 454: ...Appendix C Protocol Display Color Coding 440 Xgig Analyzer User s Guide ...

Page 455: ...pendix must be followed for the utility to work with Xgig chassis Requirements Xgig Chassis server must have Xgig Server Appkit Version 3 2 x or greater An HTTP utility that will perform an HTTP POST operation For example Wget exe V1 10 or better can be installed on the client Wget exe supports a post data parameter on the client work station where the command line interface will be used Wget exe ...

Page 456: ... standard output device MODE The MODE can be either STOP or TRIGGER With the STOP option the capture running on the specified domain will stop immediately With the TRIGGER option the capture running on the specified domain will trigger immediately and will stop after post fill is satisfied The mode is case insensitive and is a required field DOMAIN_NAME The Domain Name to be stopped or triggered F...

Page 457: ... name is MyChassis User name to access Master chassis is MyUserName Password to access Master chassis is MyPassword The following command will stop the capture for the domain wget O post data Parameters Stop My Domain 1 1 1 http MyUserName MyPassword MyChassis cgi bin domaincontrol pl Trigger Example Assume you wish to trigger the domain My Domain 1 2 1 in the Sync Group This domain is created as ...

Page 458: ...rd http MyUserName MyPassword MyChassis cgi bin domaincontrol pl Output Samples Output appears on the standard output device if the O option is used in the command line Example Output Ports on Master and on Slave Chassis The domain in this output sample is a inter chassis domain composed of ports from more than one chassis in the Sync Group The user name to access the Master Chassis is JDSU and th...

Page 459: ...nd password when forwarding the request to the 2nd chassis C wget O post data Parameters TRIGGER My Domain 2 1 1 http JDSU JDSUsnt xgigsim 7 cgi bin domaincontrol pl 10 30 45 http JDSU password xgigsim 7 cgi bin domaincontrol pl Resolving xgigsim 7 10 11 7 84 Connecting to xgigsim 7 10 11 7 84 80 connected HTTP request sent awaiting response 200 OK Length unspecified text html 0 K s Domain My Doma...

Page 460: ... 5 echo Optional Parameter echo 3 Mode to use STOP or TRIGGER defaults to TRIGGER echo echo Example echo TriggerAnalyzer My Domain 1 1 1 Xgig02005584 echo Translates to echo wget O post data Parameters TRIGGER My Domain 1 1 1 http JDSU JDSUsnt Xgig02005584 cgi bin domaincontrol pl echo echo NOTES echo 1 In a SAS domain the analyzer can be stopped with either TRIGGER or STOP commands however echo a...

Page 461: ...447 INDEX ...

Page 462: ...0 331 Bit Pattern Definitions 371 blade license key 44 177 Blade selection 40 Blink Chassis LEDs 49 blink the LEDs 36 Bookmark Editor 250 bookmark delta calculator 402 Bookmarks 247 box car view LTSSM 361 Brocade VE Port Frame Decoding 386 buffer segmentation 102 Bus Doctor Plus 437 But Noth These 112 buttons Select Ports for Domain Creation 36 buttons Select Ports to Monitor dialog 174 buttons Se...

Page 463: ...s 114 exclude TS1 TS2 SKP and EIEOS 114 expand a column 308 Expert annotation 382 F FC AE FCLP 385 FC AV Simple Streaming Protocol 385 FCoE Interpretations 106 features 4 Fiber Tap 6 Fibre Channel frame counters 356 Field Groups 299 file formats 217 Filter Group 313 filter status area 251 Filter tab 259 Filter Tab Example 259 Filtering data 250 filtering events 251 Filters creating templates 152 f...

Page 464: ...6 multiple quick filter 254 multiple quick hides 257 multiple segments save 28 multiplexed port selection examples 233 multiplexed ports 230 multiplexed SAS SATA port display 230 Multiplexing for SAS SATA 100 multi state triggering 126 N Name Table window 155 naming domains 36 navigating to events 340 navigating up 341 navigation and repeat counts 341 navigation pane OOB 278 navigation TraceView 2...

Page 465: ...A Multiplexing 100 SAS SATA Options 113 SAS SATA primitive options 117 SAS SATA Wide Port 4x Blade 35 46 SAS 1 263 SAS 2 72 263 SATA PM Port Interpretation 386 SATA Port Selection Timing 263 Save Configuration Information 225 Saving a Trace 27 223 saving the configuration TraceControl 78 Scrambled Data 332 334 SCSI Data Integrity Field T10 DIF 386 SCSI Errors trigger 134 SCSI Interpretation 386 se...

Page 466: ...ummary GUI controls 339 Traffic Summary pane 336 transaction counters 352 Transceiver Rate Select 105 transmit power 25 Tree View 328 370 Trigger captures command line 441 trigger modes 121 Trigger options 118 Trigger tab 118 Truncating frames 101 TTL In Out Selection 40 TTL Input port 41 TTL Out port 41 Tuning 67 two state triggering 122 U UDP Port Mapping 413 Unicode 252 256 Unicode string 245 u...

Page 467: ......

Page 468: ...orth America 1 844 GO VIAVI 1 844 468 4284 Latin America 52 55 5543 6644 EMEA 49 7121 862273 APAC 1 512 201 6534 All Other Regions viavisolutions com contacts email customer care viavisolutions com December 2015 English ...

Reviews: