Chapter 14, Using the Secondary Panes in Xgig TraceView
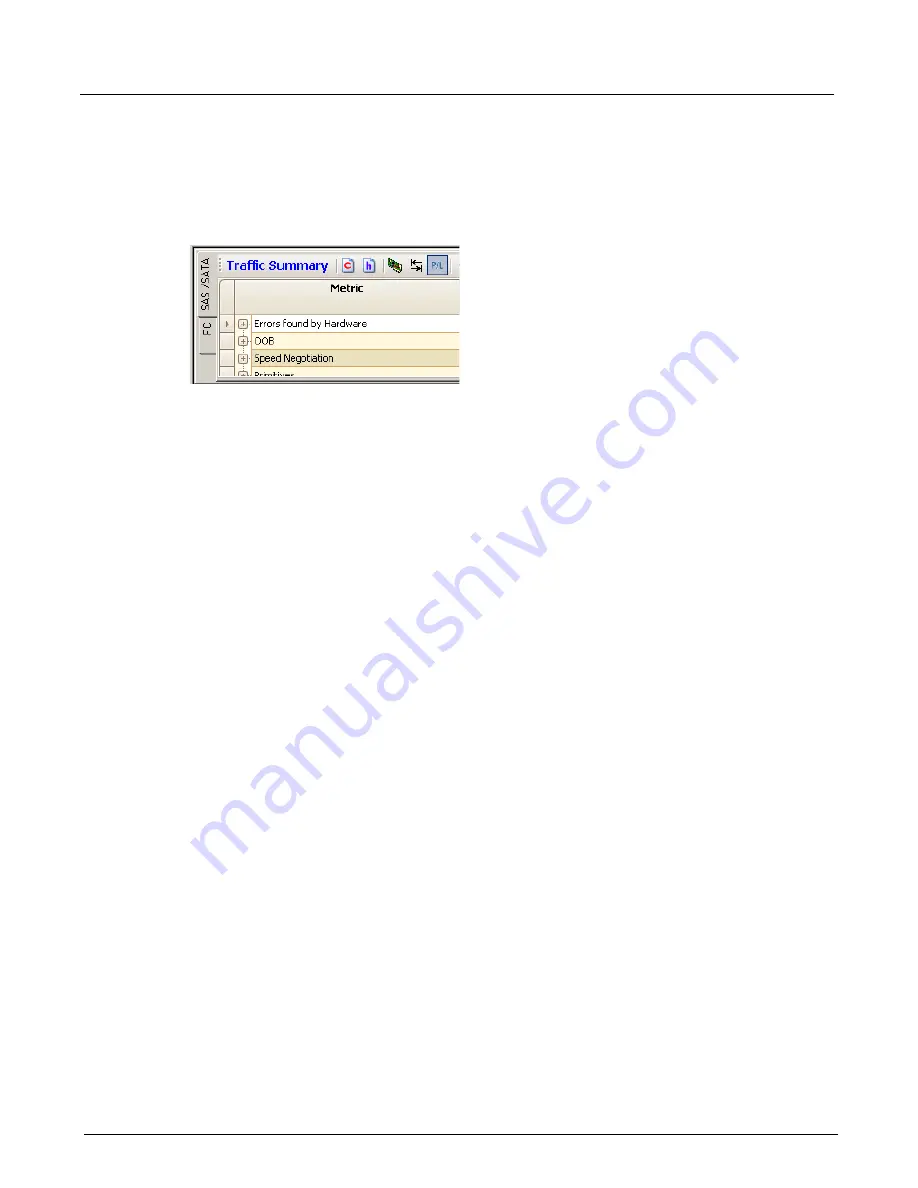
Using the Traffic Summary Pane
336
Xgig Analyzer User’s Guide
Using the Traffic Summary Pane
The Traffic Summary pane shows metrics of errors, OOB events, speed negotiation events,
primitives, ordered sets, and frames in a hierarchy. There is one Traffic Summary panel per
physical layer protocol. If a trace contains Traffic Summary data for more than one protocol, the
panel will contain a tab for each protocol.
For each panel, you can expand or collapse the tree to see the counts at different levels of
granularity. For each of the metrics, the count for each port is shown in a separate column.
Traffic Summary data is generated on the blade when the trace is captured. The Traffic Summary
data remains in the hardware as long as the trace data remains in the hardware. When you extract a
subsection of the trace, the relevant traffic summary data is also extracted. Only traces captured
using Xgig Analyzer 4.3 or higher for SAS/SATA and 4.5 or higher for Fibre Channel will contain
the Traffic Summary data. If the trace does not have Traffic Summary data, the Traffic Summary
pane will not display and the
Traffic Summary
option in the
View
menu will be grayed out.
Traffic Summary data capture is supported for 6G and 12G SAS/SATA traffic and for Fibre
Channel traffic captured on an 8G Xgig blade, a 16G Xgig5000 blade, or 16G ports on Xgig1000
systems.
You can select a cell in the metrics grid and use the toolbar controls to navigate to any occurrence
of that event. You can also go to any arbitrary occurrence just by typing the number of the
occurrence in the toolbar. When you navigate to an event, both the main decode grid and the
Dword grid will be scrolled to the point of time at which that event occurred.
Use the
Show Pane
option from the
View > Traffic Summary
menu to show/hide the Traffic
Summary pane.
Two examples of the TraceView main window are shown below. Figure 152 shows a SAS/SATA
trace. See
“Traffic Summary SAS/SATA Counters” on page 342
for a description of Traffic
Summary SAS/SATA metrics. Figure 153 shows a Fibre Channel trace. See
Fibre Channel Counters” on page 355
for a description of Fibre Channel Traffic Summary metrics.
Summary of Contents for Xgig
Page 1: ...Xgig Analyzer Version 7 3 User s Guide ...
Page 2: ......
Page 3: ...Viavi Solutions 1 844 GO VIAVI www viavisolutions com Xgig Analyzer Version 7 3 User s Guide ...
Page 6: ...Xgig Analyzer User s Guide Page iv Version 7 3 December 2015 ...
Page 7: ...v CONTENTS ...
Page 15: ...1 PART ONE Using Xgig Analyzer ...
Page 16: ...PART ONE Using Xgig Analyzer 2 Xgig Analyzer User s Guide ...
Page 27: ...13 PART TWO Using Xgig TraceControl ...
Page 28: ...PART TWO Using Xgig TraceControl 14 Xgig Analyzer User s Guide ...
Page 29: ...15 Chapter 2 About Xgig TraceControl In this chapter Introduction to TraceControl ...
Page 176: ...Chapter 6 Xgig TraceControl Hints and Tips Keyboard Shortcuts 162 Xgig Analyzer User s Guide ...
Page 177: ...163 PART THREE Using Xgig Performance Monitor ...
Page 178: ...PART THREE Using Xgig Performance Monitor 164 Xgig Analyzer User s Guide ...
Page 223: ...209 PART FOUR Using Xgig TraceView ...
Page 224: ...PART FOUR Using Xgig TraceView 210 Xgig Analyzer User s Guide ...
Page 225: ...211 Chapter 11 About Xgig TraceView In this chapter Introducing Xgig TraceView ...
Page 382: ...Chapter 15 Xgig TraceView Histograms Histogram Controls 368 Xgig Analyzer User s Guide ...
Page 383: ...369 Chapter 16 Xgig TraceView Template Editor In this chapter Using Template Editor ...
Page 437: ...423 PART FIVE Using Xgig Expert ...
Page 438: ...PART FIVE Using Xgig Expert 424 Xgig Analyzer User s Guide ...
Page 442: ...Chapter 21 Xgig Expert 428 Xgig Analyzer User s Guide Figure 194 Xgig Expert Graph View ...
Page 443: ...429 PART SIX Appendices ...
Page 444: ...PART SIX Appendices 430 Xgig Analyzer User s Guide ...
Page 454: ...Appendix C Protocol Display Color Coding 440 Xgig Analyzer User s Guide ...
Page 461: ...447 INDEX ...
Page 467: ......


