Chapter 4, Xgig TraceControl Capture Configuration
Configure Ports or Domains
82
Xgig Analyzer User’s Guide
Base Filename (and Location)
Data is saved as one file per port or link with the start date, start time, and port or link name
appended to the base file name. The file name format is:
<
basefilename
> _<
day_month_year_hour.minute.second>_
<
Port_Name or
Link_Name
>; for example,
ChartLog_28_02_07_13.07.22_FC Port(1,1,1)
. All statistics in
current domain in TraceControl will be saved to the file, one file for each port or link.
Stop after
Sets the overall time, in number of days, hours, and minutes, for which information will be written
to log files. For example, if the
Interval
is set to 1 minute and
Stop after
is set to 2 hours (120
minutes), 120 log entries will be written to each single-port log file.
Interval
Sets the interval for gathering and writing data to the log file. Data for each interval shows in
Microsoft Excel as another row. Options available are once per 1, 5, 20, or 30 seconds, 1 minute or
1 hour.
Delimiter
Delimiters provided are comma ( , ) , semicolon ( ; ) , or tab ( \t ). The delimiter specifies the
character(s) inserted in the .csv file to determine the end of a value and the beginning of a new
value. Delimiters are interpreted by Microsoft Excel when the .csv file is imported. Comma is the
default choice for the delimiter, which is also the default delimiter used by Microsoft Excel.
Select Columns to Log
You can select which columns to log by clicking the check boxes in the tree displayed. Clicking
All Columns at the top of the tree selects all TraceControl columns that are available for logging.
You can click the
Currently Visible
button to log all columns that are currently displayed in the
TraceControl’s main window. You can also click the
Valid for Ports
button to log all the columns
that are relevant to the type of ports in the domain.
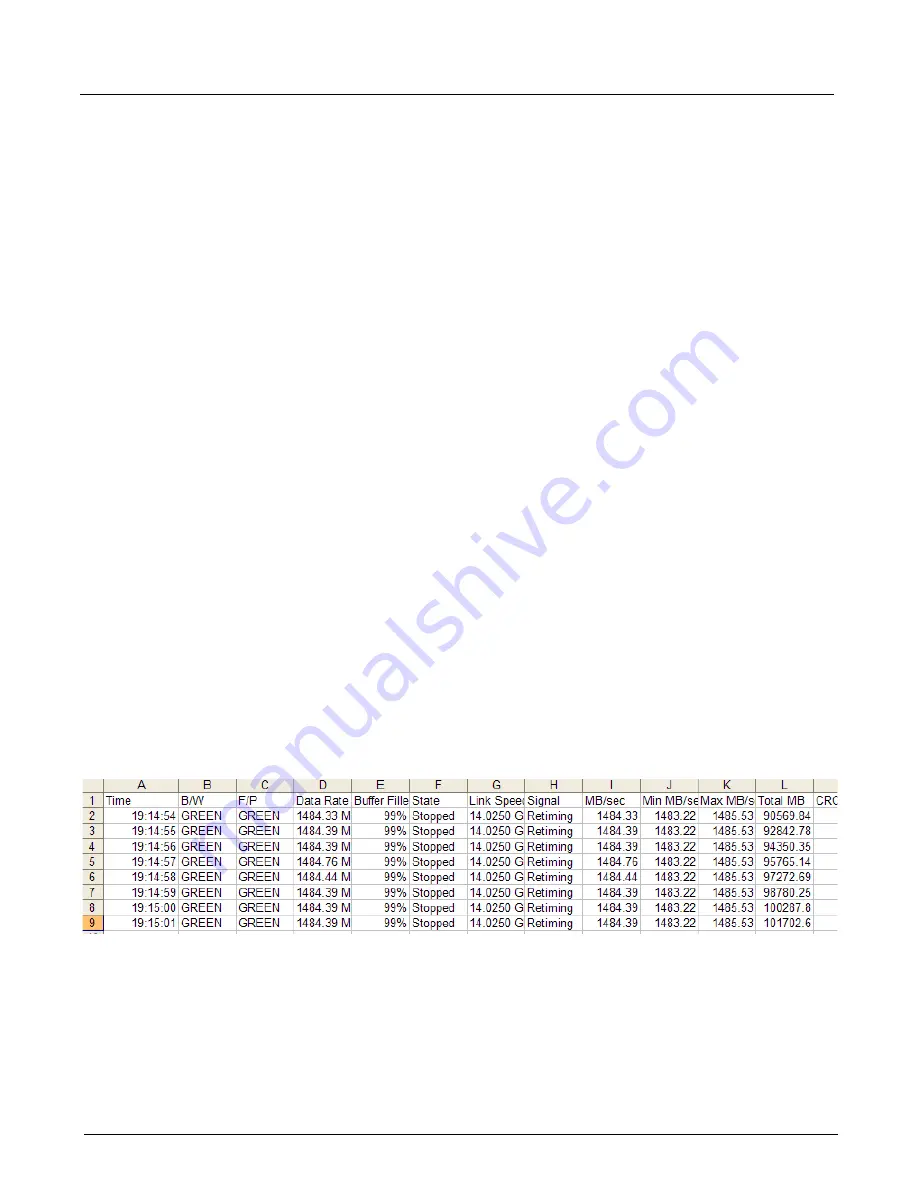
An example .csv file shown in Microsoft Excel for a single port is shown in Figure 35. Note that
for display purposes not all entries are shown.
Figure 35: Example .CSV Log File
Summary of Contents for Xgig
Page 1: ...Xgig Analyzer Version 7 3 User s Guide ...
Page 2: ......
Page 3: ...Viavi Solutions 1 844 GO VIAVI www viavisolutions com Xgig Analyzer Version 7 3 User s Guide ...
Page 6: ...Xgig Analyzer User s Guide Page iv Version 7 3 December 2015 ...
Page 7: ...v CONTENTS ...
Page 15: ...1 PART ONE Using Xgig Analyzer ...
Page 16: ...PART ONE Using Xgig Analyzer 2 Xgig Analyzer User s Guide ...
Page 27: ...13 PART TWO Using Xgig TraceControl ...
Page 28: ...PART TWO Using Xgig TraceControl 14 Xgig Analyzer User s Guide ...
Page 29: ...15 Chapter 2 About Xgig TraceControl In this chapter Introduction to TraceControl ...
Page 176: ...Chapter 6 Xgig TraceControl Hints and Tips Keyboard Shortcuts 162 Xgig Analyzer User s Guide ...
Page 177: ...163 PART THREE Using Xgig Performance Monitor ...
Page 178: ...PART THREE Using Xgig Performance Monitor 164 Xgig Analyzer User s Guide ...
Page 223: ...209 PART FOUR Using Xgig TraceView ...
Page 224: ...PART FOUR Using Xgig TraceView 210 Xgig Analyzer User s Guide ...
Page 225: ...211 Chapter 11 About Xgig TraceView In this chapter Introducing Xgig TraceView ...
Page 382: ...Chapter 15 Xgig TraceView Histograms Histogram Controls 368 Xgig Analyzer User s Guide ...
Page 383: ...369 Chapter 16 Xgig TraceView Template Editor In this chapter Using Template Editor ...
Page 437: ...423 PART FIVE Using Xgig Expert ...
Page 438: ...PART FIVE Using Xgig Expert 424 Xgig Analyzer User s Guide ...
Page 442: ...Chapter 21 Xgig Expert 428 Xgig Analyzer User s Guide Figure 194 Xgig Expert Graph View ...
Page 443: ...429 PART SIX Appendices ...
Page 444: ...PART SIX Appendices 430 Xgig Analyzer User s Guide ...
Page 454: ...Appendix C Protocol Display Color Coding 440 Xgig Analyzer User s Guide ...
Page 461: ...447 INDEX ...
Page 467: ......


