Chapter 10, Xgig Performance Monitor Configuration
Monitor Views
180
Xgig Analyzer User’s Guide
Monitor Views
This section discusses the different views in Performance Monitor.
Resource Browser
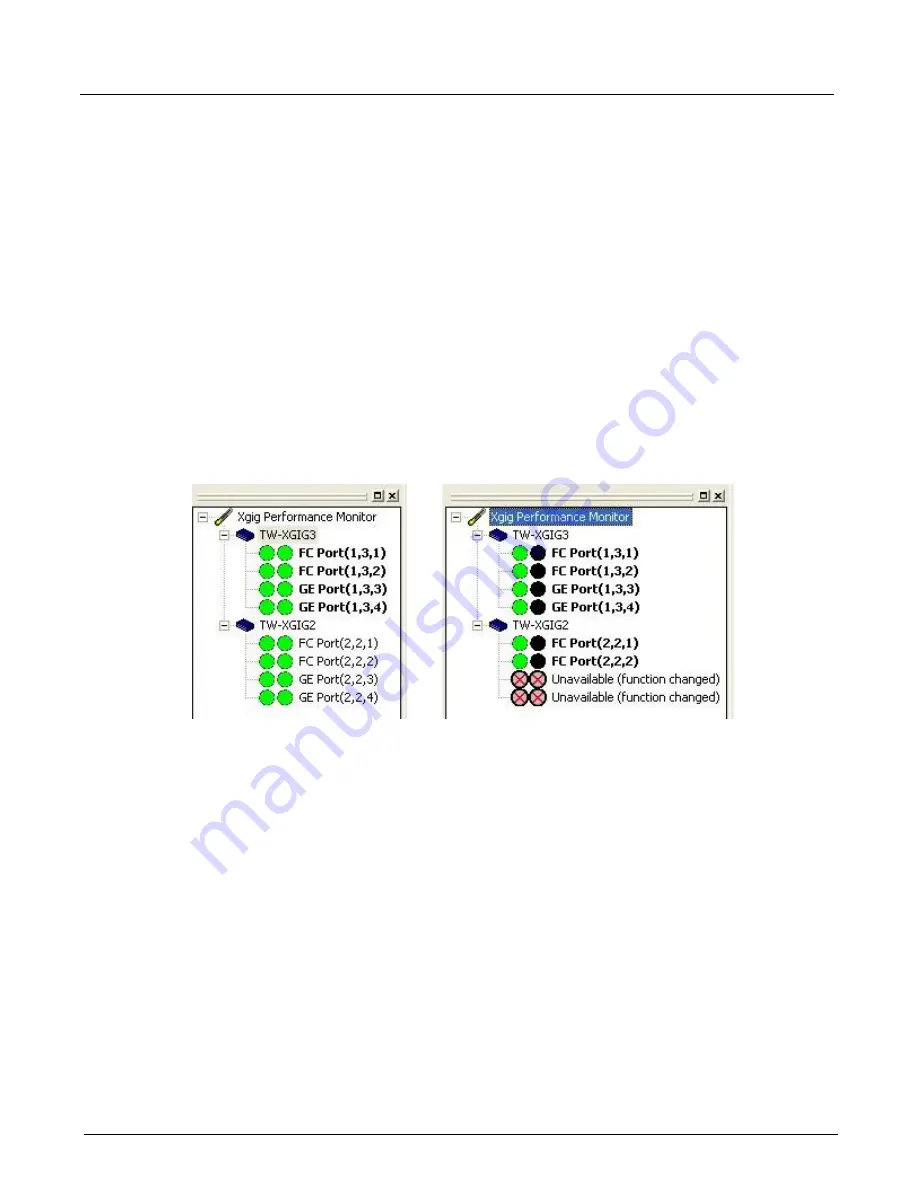
The Resource Browser shows all ports that can be monitored from Performance Monitor. The
Words/Bytes
status LED and the
Frames/Packets
status LED are shown for each port. The
Words/Bytes
status LED is on the left and the
Frames/Packets
status LED is next to the port
name. Select the ports you wish to display in the Performance Monitor views. See
for a description of the LED colors and their meaning.
When you select a port or a chassis in the Resource Browser, the monitor views will automatically
display monitoring information for the selected ports. For example, in Figure 72 if you select
chassis TW-XGIG3, then all monitor windows will show information for the 4 ports under the
TW-XGIG3 chassis.
Figure 72: Resource Browser Examples
When you choose ports from the
Select Ports to Monitor
dialog box and press
OK
, the Resource
Browser lists the chassis and ports you have selected and Performance Monitor begins the
monitoring process. If you have selected more than 32 ports, Performance Monitor begins
monitoring only the first 32 ports; however, all selected ports will display in the Resource
Browser.
When launching Performance Monitor from the TraceControl application, the Resource Browser
lists the chassis and ports in the current domain. If there are more than 32 ports, Performance
Monitor begins monitoring only the first 32 ports; however, all ports in the domain will display in
the Resource Browser.
From the Resource Browser you can select a subset of ports to monitor. Use the
Shift
and
Ctrl
keys
to select a group of ports, or select ports individually by clicking on the port. You can select ports
from multiple chassis and all selected ports will be displayed in the Resource Browser.
You can also select all ports for a chassis by clicking on the chassis name. You can only select one
chassis at a time, and cannot use either the
Shift
or
Ctrl
key to add ports or chassis to your
selection.
Summary of Contents for Xgig
Page 1: ...Xgig Analyzer Version 7 3 User s Guide ...
Page 2: ......
Page 3: ...Viavi Solutions 1 844 GO VIAVI www viavisolutions com Xgig Analyzer Version 7 3 User s Guide ...
Page 6: ...Xgig Analyzer User s Guide Page iv Version 7 3 December 2015 ...
Page 7: ...v CONTENTS ...
Page 15: ...1 PART ONE Using Xgig Analyzer ...
Page 16: ...PART ONE Using Xgig Analyzer 2 Xgig Analyzer User s Guide ...
Page 27: ...13 PART TWO Using Xgig TraceControl ...
Page 28: ...PART TWO Using Xgig TraceControl 14 Xgig Analyzer User s Guide ...
Page 29: ...15 Chapter 2 About Xgig TraceControl In this chapter Introduction to TraceControl ...
Page 176: ...Chapter 6 Xgig TraceControl Hints and Tips Keyboard Shortcuts 162 Xgig Analyzer User s Guide ...
Page 177: ...163 PART THREE Using Xgig Performance Monitor ...
Page 178: ...PART THREE Using Xgig Performance Monitor 164 Xgig Analyzer User s Guide ...
Page 223: ...209 PART FOUR Using Xgig TraceView ...
Page 224: ...PART FOUR Using Xgig TraceView 210 Xgig Analyzer User s Guide ...
Page 225: ...211 Chapter 11 About Xgig TraceView In this chapter Introducing Xgig TraceView ...
Page 382: ...Chapter 15 Xgig TraceView Histograms Histogram Controls 368 Xgig Analyzer User s Guide ...
Page 383: ...369 Chapter 16 Xgig TraceView Template Editor In this chapter Using Template Editor ...
Page 437: ...423 PART FIVE Using Xgig Expert ...
Page 438: ...PART FIVE Using Xgig Expert 424 Xgig Analyzer User s Guide ...
Page 442: ...Chapter 21 Xgig Expert 428 Xgig Analyzer User s Guide Figure 194 Xgig Expert Graph View ...
Page 443: ...429 PART SIX Appendices ...
Page 444: ...PART SIX Appendices 430 Xgig Analyzer User s Guide ...
Page 454: ...Appendix C Protocol Display Color Coding 440 Xgig Analyzer User s Guide ...
Page 461: ...447 INDEX ...
Page 467: ......


