Chapter 13, Configuring Xgig TraceView
Working With Columns
292
Xgig Analyzer User’s Guide
For example, assume port 1 captures data from second 1 through second 4 and port 2 captures data
from second 2 through second 4. When showing only overlapping data, the overlapping data will
be the data from second 2 through second 4. When showing all trace data, the data from second 1
through second 4 is displayed, but the first part of the data contains data only from port 1.
Working With Columns
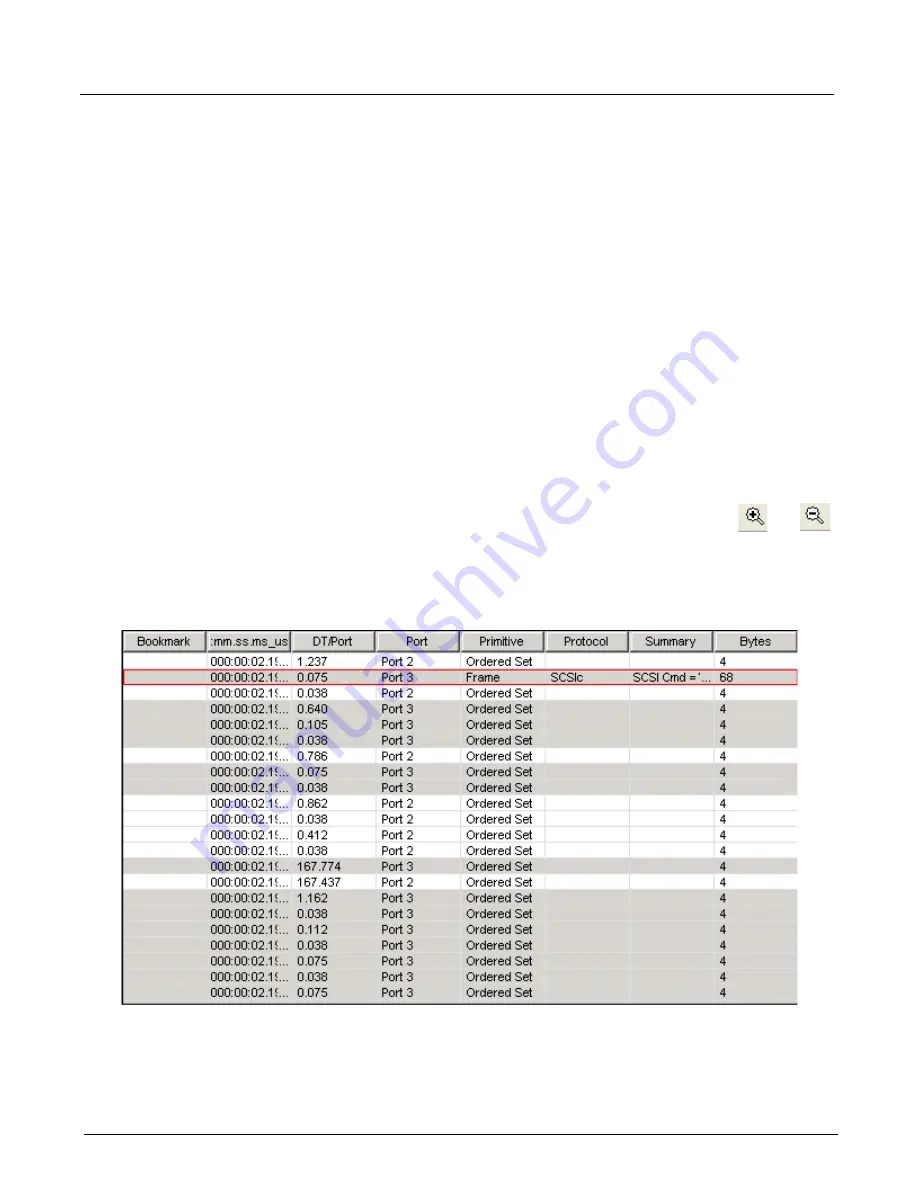
The basic display in TraceView is a spreadsheet with each trace event shown as a row and the
interpretation of the data for each event displayed in columns. You can add, delete, or move
columns. Some columns are pre-defined summary fields that contain extensive decode
information. You can set up the columns in any way you wish, including adding the exact
information you want to any column. TraceView includes a large library of pre-defined columns
that you can add to the spreadsheet display.
In the main spreadsheet view, traffic is summed up into one row events. Frames are shown in one
row with a summary. In SAS/SATA, only OOB events (as determined by the state machines in the
hardware) are shown. Also, SAS/SATA Primitive Sequences are shown as single row events,
unless they are interrupted by errors. Error are always shown in the main spreadsheet view. If you
wish to see the word-by-word details of this events, use the Details Pane.
You can enlarge or reduce the size of the font in the spreadsheet view by using the
and
zoom buttons.
An example of the spreadsheet display of events is shown below.
Figure 134: Example Spreadsheet Display
Summary of Contents for Xgig
Page 1: ...Xgig Analyzer Version 7 3 User s Guide ...
Page 2: ......
Page 3: ...Viavi Solutions 1 844 GO VIAVI www viavisolutions com Xgig Analyzer Version 7 3 User s Guide ...
Page 6: ...Xgig Analyzer User s Guide Page iv Version 7 3 December 2015 ...
Page 7: ...v CONTENTS ...
Page 15: ...1 PART ONE Using Xgig Analyzer ...
Page 16: ...PART ONE Using Xgig Analyzer 2 Xgig Analyzer User s Guide ...
Page 27: ...13 PART TWO Using Xgig TraceControl ...
Page 28: ...PART TWO Using Xgig TraceControl 14 Xgig Analyzer User s Guide ...
Page 29: ...15 Chapter 2 About Xgig TraceControl In this chapter Introduction to TraceControl ...
Page 176: ...Chapter 6 Xgig TraceControl Hints and Tips Keyboard Shortcuts 162 Xgig Analyzer User s Guide ...
Page 177: ...163 PART THREE Using Xgig Performance Monitor ...
Page 178: ...PART THREE Using Xgig Performance Monitor 164 Xgig Analyzer User s Guide ...
Page 223: ...209 PART FOUR Using Xgig TraceView ...
Page 224: ...PART FOUR Using Xgig TraceView 210 Xgig Analyzer User s Guide ...
Page 225: ...211 Chapter 11 About Xgig TraceView In this chapter Introducing Xgig TraceView ...
Page 382: ...Chapter 15 Xgig TraceView Histograms Histogram Controls 368 Xgig Analyzer User s Guide ...
Page 383: ...369 Chapter 16 Xgig TraceView Template Editor In this chapter Using Template Editor ...
Page 437: ...423 PART FIVE Using Xgig Expert ...
Page 438: ...PART FIVE Using Xgig Expert 424 Xgig Analyzer User s Guide ...
Page 442: ...Chapter 21 Xgig Expert 428 Xgig Analyzer User s Guide Figure 194 Xgig Expert Graph View ...
Page 443: ...429 PART SIX Appendices ...
Page 444: ...PART SIX Appendices 430 Xgig Analyzer User s Guide ...
Page 454: ...Appendix C Protocol Display Color Coding 440 Xgig Analyzer User s Guide ...
Page 461: ...447 INDEX ...
Page 467: ......


