Monitor Views
Chapter 10, Xgig Performance Monitor Configuration
Xgig Analyzer User’s Guide
181
All selected ports are displayed in bold characters. Unavailable ports are displayed with the text
Unavailable (function changed)
next to the port labels. This status will only be seen when the
ports being monitored have changed function (via another client application). To begin monitoring
these ports again, return to the
Select Ports to Monitor
dialog and re-select the ports.
Selections made in the Resource Browser have no effect on the LED Summary View. A count of
all analyzer ports in the Resource Browser are shown within this view.
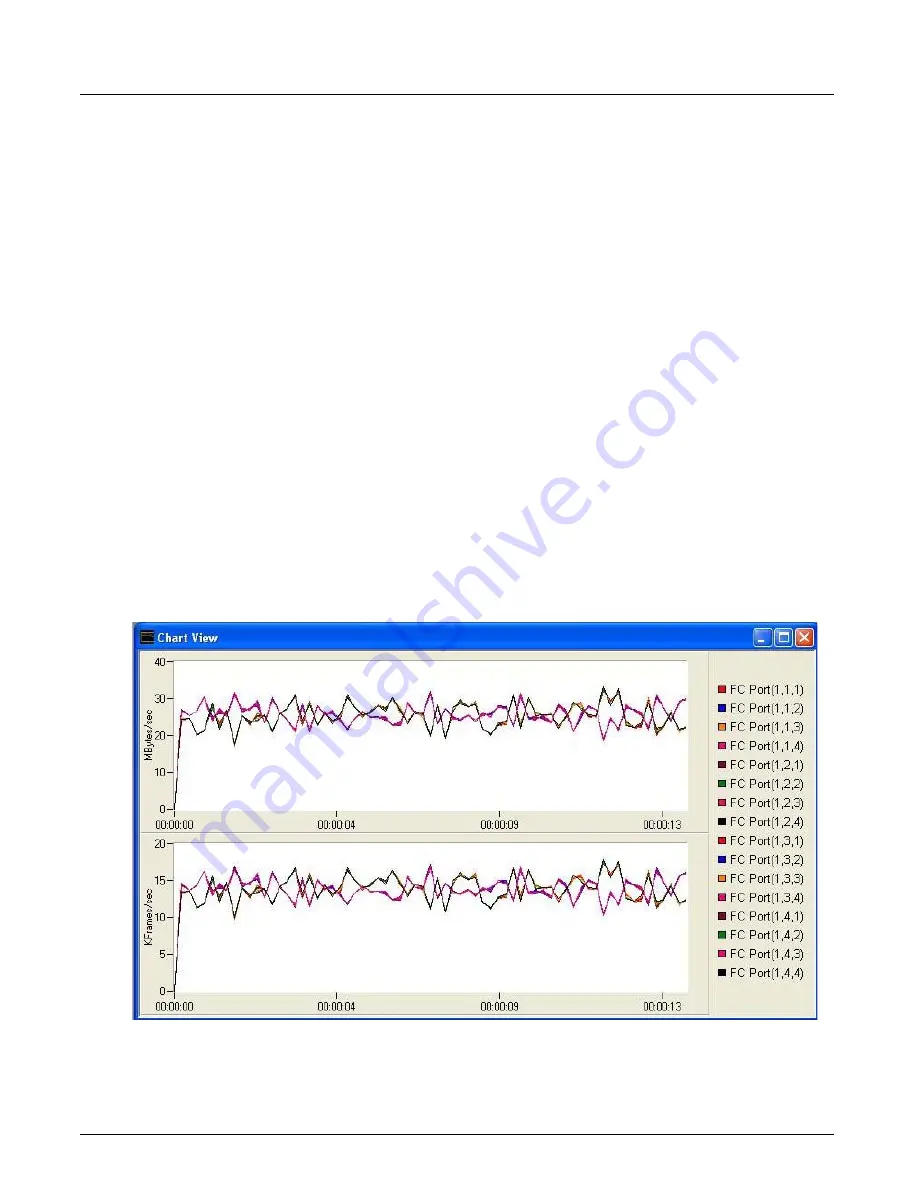
Chart View
The
Chart View
presents a line graph of the transfer rate for all selected analyzer ports and links.
Rates are expressed in Mbytes/sec and Kframes/sec. A
Total
line graph is displayed also
depending on the selection from the Resource Browser.
When the
Frame Type
in the
Preferences
dialog is set to
SCSI Frames
, the
Chart View
displays
transfer rates in SCSI Mbytes/sec (frames with RCtl=0x01 and Type=0x08) and SCSI Kilo
Commands per second (frames with RCtl=0x06 and Type=0x08).
Right-click the pane to access the
Preferences
and
Metric Options
dialog boxes. From the menu
that pops-up to select a configuration dialog, you are also provided a means to show or hide the
legend. All scaling for the charts is done automatically and does not require configuration.
The MBytes/sec. axis can be changed to display as a utilization percentage. Right-click the graph
and select the
Show Utilization
“Utilization Display Option” on page 205.
Figure 73: Xgig Performance Monitor Chart View
Summary of Contents for Xgig
Page 1: ...Xgig Analyzer Version 7 3 User s Guide ...
Page 2: ......
Page 3: ...Viavi Solutions 1 844 GO VIAVI www viavisolutions com Xgig Analyzer Version 7 3 User s Guide ...
Page 6: ...Xgig Analyzer User s Guide Page iv Version 7 3 December 2015 ...
Page 7: ...v CONTENTS ...
Page 15: ...1 PART ONE Using Xgig Analyzer ...
Page 16: ...PART ONE Using Xgig Analyzer 2 Xgig Analyzer User s Guide ...
Page 27: ...13 PART TWO Using Xgig TraceControl ...
Page 28: ...PART TWO Using Xgig TraceControl 14 Xgig Analyzer User s Guide ...
Page 29: ...15 Chapter 2 About Xgig TraceControl In this chapter Introduction to TraceControl ...
Page 176: ...Chapter 6 Xgig TraceControl Hints and Tips Keyboard Shortcuts 162 Xgig Analyzer User s Guide ...
Page 177: ...163 PART THREE Using Xgig Performance Monitor ...
Page 178: ...PART THREE Using Xgig Performance Monitor 164 Xgig Analyzer User s Guide ...
Page 223: ...209 PART FOUR Using Xgig TraceView ...
Page 224: ...PART FOUR Using Xgig TraceView 210 Xgig Analyzer User s Guide ...
Page 225: ...211 Chapter 11 About Xgig TraceView In this chapter Introducing Xgig TraceView ...
Page 382: ...Chapter 15 Xgig TraceView Histograms Histogram Controls 368 Xgig Analyzer User s Guide ...
Page 383: ...369 Chapter 16 Xgig TraceView Template Editor In this chapter Using Template Editor ...
Page 437: ...423 PART FIVE Using Xgig Expert ...
Page 438: ...PART FIVE Using Xgig Expert 424 Xgig Analyzer User s Guide ...
Page 442: ...Chapter 21 Xgig Expert 428 Xgig Analyzer User s Guide Figure 194 Xgig Expert Graph View ...
Page 443: ...429 PART SIX Appendices ...
Page 444: ...PART SIX Appendices 430 Xgig Analyzer User s Guide ...
Page 454: ...Appendix C Protocol Display Color Coding 440 Xgig Analyzer User s Guide ...
Page 461: ...447 INDEX ...
Page 467: ......


